. 2012 Jul 20;287(30):24929-40.
doi: 10.1074/jbc.M112.347773. Epub 2012 Jun 4.

Molecular characteristics of Clostridium perfringens TpeL toxin and consequences of mono-O-GlcNAcylation of Ras in living cells

Affiliations

Molecular characteristics of Clostridium perfringens TpeL toxin and consequences of mono-O-GlcNAcylation of Ras in living cells

Gregor Guttenberg et al. J Biol Chem. .

Abstract

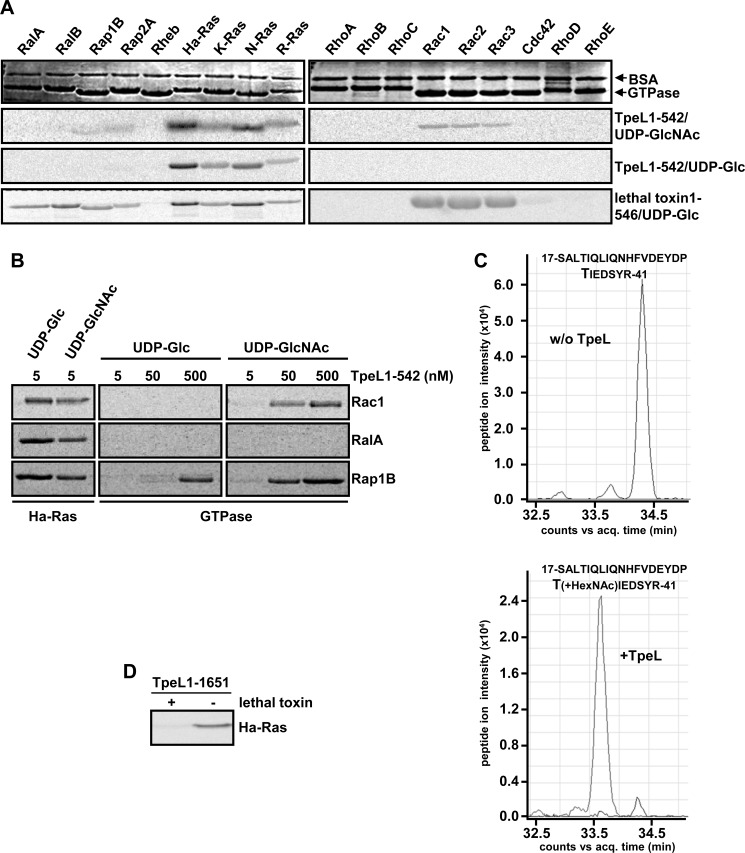
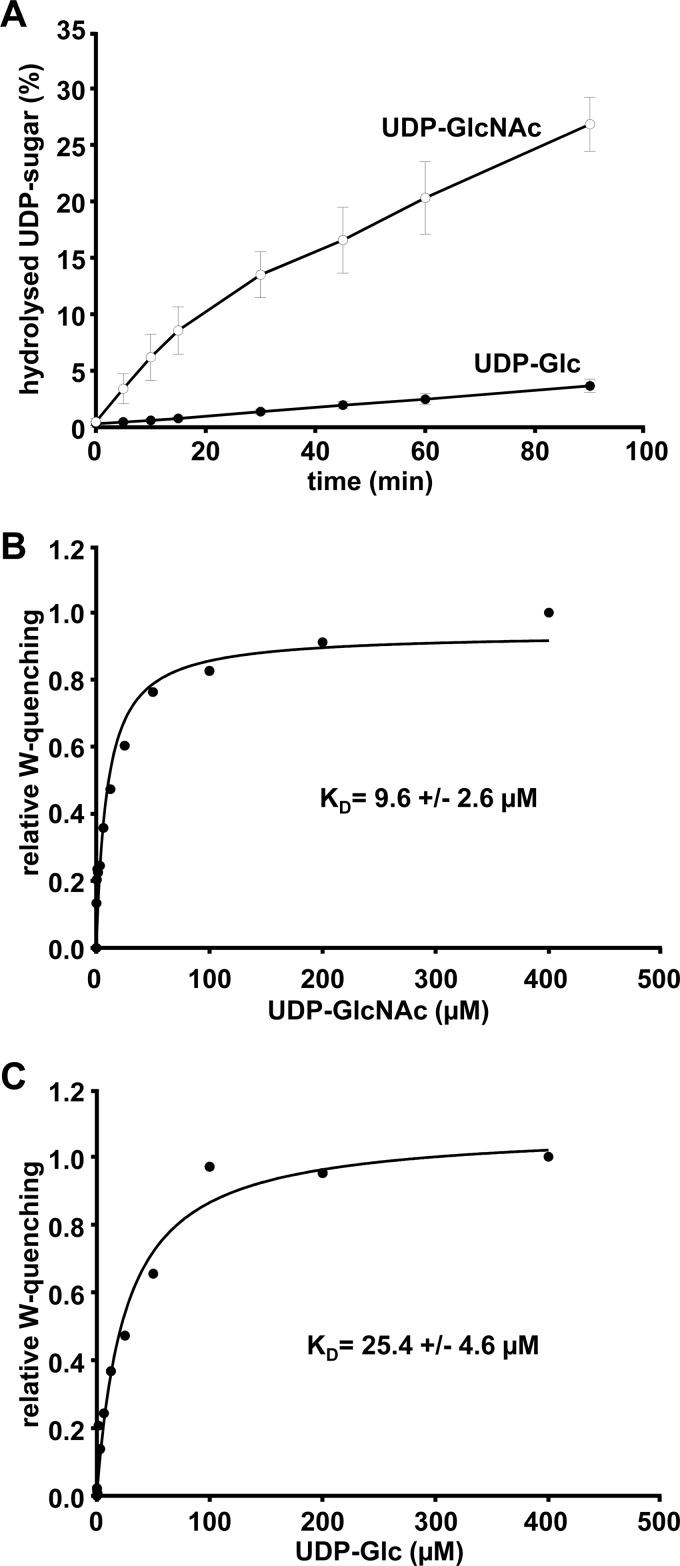
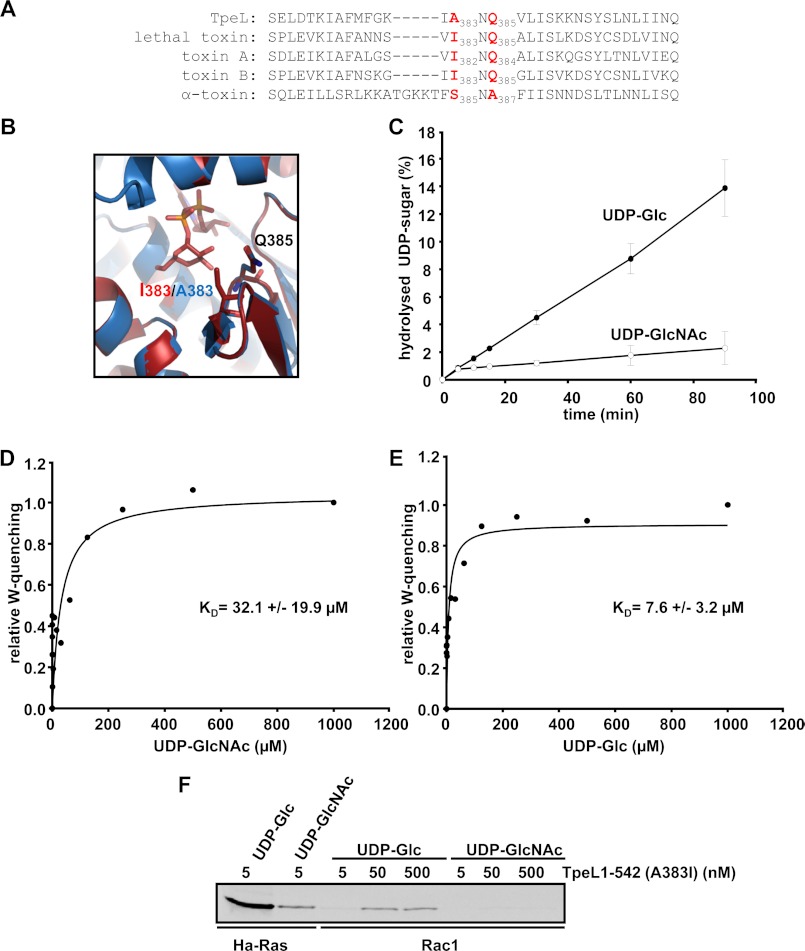
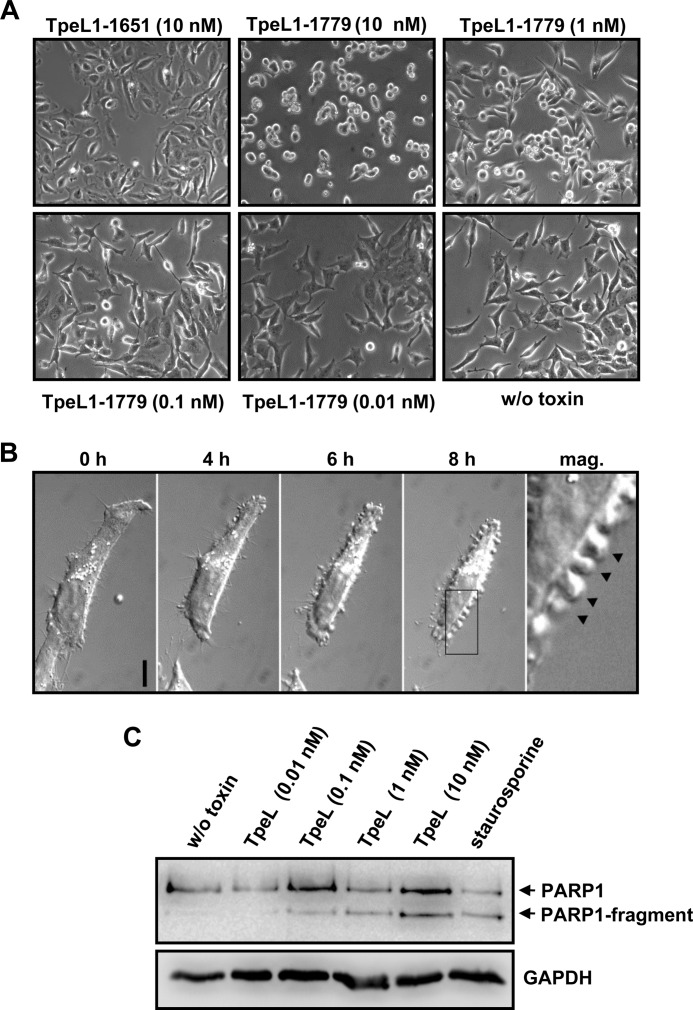
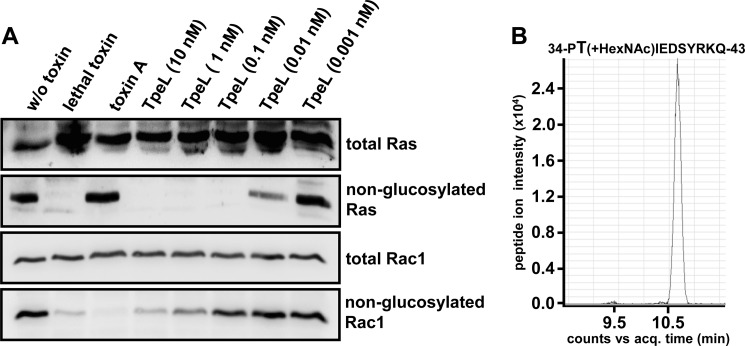
TpeL is a member of the family of clostridial glucosylating toxins produced by Clostridium perfringens type A, B, and C strains. In contrast to other members of this toxin family, it lacks a C-terminal polypeptide repeat domain, which is suggested to be involved in target cell binding. It was shown that the glucosyltransferase domain of TpeL modifies Ras in vitro by mono-O-glucosylation or mono-O-GlcNAcylation (Nagahama, M., Ohkubo, A., Oda, M., Kobayashi, K., Amimoto, K., Miyamoto, K., and Sakurai, J. (2011) Infect. Immun. 79, 905-910). Here we show that TpeL preferably utilizes UDP-N-acetylglucosamine (UDP-GlcNAc) as a sugar donor. Change of alanine 383 of TpeL to isoleucine turns the sugar donor preference from UDP-GlcNAc to UDP-glucose. In contrast to previous studies, we show that Rac is a poor substrate in vitro and in vivo and requires 1-2 magnitudes higher toxin concentrations for modification by TpeL. The toxin is autoproteolytically processed in the presence of inositol hexakisphosphate (InsP(6)) by an intrinsic cysteine protease domain, located next to the glucosyltransferase domain. A C-terminally extended TpeL full-length variant (TpeL1-1779) induces apoptosis in HeLa cells (most likely by mono-O-GlcNAcylation of Ras), and inhibits Ras signaling including Ras-Raf interaction and ERK activation. In addition, TpeL blocks Ras signaling in rat pheochromocytoma PC12 cells. TpeL is a glucosylating toxin, which modifies Ras and induces apoptosis in target cells without having a typical C-terminal polypeptide repeat domain.


Figures

FIGURE 1.
FIGURE 1.
Ras-GTPases are the preferred substrates of TpeL in vitro. A, protein substrate specificity of TpeL. Glucosylation of the indicated GST-GTPases (3 μg) with recombinant TpeL1–542 or lethal toxin1–546 (each 5 nm) in the presence of radiolabeled UDP-GlcNAc or UDP-Glc (each 10 μm) for 10 min at 37 °C. The samples were subjected to SDS-PAGE and modified GTPases were visualized by autoradiography. B, comparative analysis of the in vitro glucosylation of Ha-Ras with Rac1, RalA and Rap1B by TpeL1–542. GST-GTPases (3 μg) were incubated with indicated concentrations of TpeL1–542 in the presence of radiolabeled UDP-GlcNAc or UDP-Glc (each 10 μm) for 10 min at 37 °C. C. Acceptor amino acid in Ha-Ras. Ha-Ras (5 μg) was incubated with or without TpeL1–1651 (250 nm) in the presence of UDP-GlcNAc (100 μm) for 1 h at 37 °C. Following SDS-PAGE, the respective protein bands were excised and analyzed by tandem mass spectrometry. The extracted ion chromatograms of the unmodified peptide (acq. time: 34.3 min, m/z = 989.8172 (3+)) and the GlcNAc-modified peptide (acq. time: 33.7 min, m/z = 1057.5103 (3+)) are shown. D, lethal toxin and TpeL modify threonine 35 in Ha-Ras. Ha-Ras was eventually preincubated with lethal toxin (100 nm) (as indicated) and UDP-Glc (10 μm) for 30 min at 37 °C. Subsequently, in vitro glucosylation with TpeL1–1651 (100 nm) and radiolabeled UDP-GlcNAc (10 μm) was performed for 45 min at 37 °C. The samples were subjected to SDS-PAGE and modified Ha-Ras was visualized by autoradiography.
FIGURE 2.
FIGURE 2.
UDP-GlcNAc is the preferred donor substrate of TpeL in vitro. A, donor substrate specificity of TpeL. UDP-sugar hydrolase assay of TpeL1–542 with radiolabeled UDP-Glc and UDP-GlcNAc, respectively. At indicated time points samples were subjected to thin layer chromatography. The hydrolyzed sugars were visualized by autoradiography and the signal intensities quantified with ImageQuant. Calculation of kcat values was done by using time points 5, 10, and 15 min. B and C, determination of the binding affinity of UDP-GlcNAc (B) and UDP-Glc (C) to the glucosyltransferase of TpeL (TpeL1–542) by ligand-induced quenching of the intrinsic tryptophan fluorescence. The maximal quenching efficiency of the respective UDP-sugars was set to 1.0 and the increase of the relative tryptophan quenching (W-quenching) is represented as a function of the UDP-sugar concentration.
FIGURE 3.
FIGURE 3.
Amino acids involved in UDP-sugar binding of TpeL. A, alignment of primary sequences of TpeL and other CGTs representing the putative amino acid sequence segment responsible for the donor substrate specificity. The involved amino acids were numbered and highlighted in red. B, depiction of the amino acid motif responsible for donor substrate specificity of TpeL and lethal toxin. Structural alignment of the glucosyltransferase domain of lethal toxin (in red) and the glucosyltransferase domain of TpeL (in blue). The UDP-sugar binding site of lethal toxin and TpeL is shown. The structure model of the glucosyltransferase domain of TpeL was created by SWISS-MODEL (alignment mode) using as matrix the crystal structure of the glucosyltransferase domain of lethal toxin in complex with Mn2+-ion and UDP-Glc. The glucosyltransferase domains are shown with ribbons. Mn2+-ion, UDP-Glc, and isoleucine 383, alanine 383, and glutamine 385 are shown with sticks. C, donor substrate specificity of TpeL1–542 (A383I). UDP-sugar hydrolase assay of TpeL1–542 (A383I) with radiolabeled UDP-Glc and UDP-GlcNAc, respectively. At indicated time points samples were subjected to thin layer chromatography. The hydrolyzed sugars were visualized by autoradiography and the signal intensities quantified with ImageQuant. Calculation of kcat values was done by using time points 5, 10, and 15 min. D and E, determination of the binding affinity of UDP-GlcNAc (B) and UDP-Glc (C) to TpeL1–542 (A383I) by ligand-induced quenching of the intrinsic tryptophan fluorescence. The maximal quenching efficiency of the respective UDP-sugars was set to 1.0 and the increase of the relative tryptophan quenching (W-quenching) is represented as a function of the UDP-sugar concentration. F, substrate specificity of TpeL1–542 (A383I). Glucosylation of the indicated GST-GTPases (3 μg) with TpeL1–542 (A383I) (for Ha-Ras 5 nm, for Rac1 5, 50, 500 nm, respectively) in the presence of radiolabeled UDP-GlcNAc or UDP-Glc (each 10 μm) for 10 min at 37 °C. The samples were subjected to SDS-PAGE and modified GTPases were visualized by autoradiography.
FIGURE 4.
FIGURE 4.
Autoprocessing of TpeL by the intrinsic cysteine protease domain. A, InsP6-induced autoprocessing of TpeL1–805. TpeL1–805 (2 μg) was incubated with increasing concentrations of InsP6 (as indicated) for 1 h at 37 °C. Cleavage products were then separated by SDS-PAGE and stained with Coomassie. Arrow indicates the cleavage product TpeL1–542 (glucosyltransferase domain). B, identification of the catalytic cysteine residue of the CPD of TpeL. TpeL1–805 and TpeL1–805 (C696A) (each 2 μg), were incubated in the presence of InsP6 (100 μm) for 1 h at 37 °C. Cleavage products were then separated by SDS-PAGE and stained with Coomassie. Arrow indicates the cleavage product TpeL1–542 (glucosyltransferase domain). C, in vitro glucosylation of Ha-Ras with TpeL1–805 and TpeL1–805 (C696A) (each 3 μg) in the presence of radiolabeled UDP-GlcNAc for 30 min at 37 °C. The samples were subjected to SDS-PAGE and modified GTPases were visualized by autoradiography. D, binding affinity of InsP6 to the CPD of TpeL measured by isothermal calorimetry. Isothermal calorimetry was carried out twice with TpeL543–805 (70 μm) at pH 7.4 in the presence InsP6 (700 μm).
FIGURE 5.
FIGURE 5.
Intoxication characteristics of full-length TpeL in living cells. A, HeLa cells were intoxicated with or without TpeL1–1651 (10 nm) or with indicated concentrations of TpeL1–1779 overnight at 37 °C, prior to microscopy to analyze the cell morphology. B, TpeL-induced apoptotic blebbing in HeLa cells. HeLa cells were intoxicated with TpeL (10 nm) at 37 °C and observed over time by live cell imaging using an inverted microscope. Representative images were taken at indicated time points. The black box (image after 8 h) represents a magnified image area where apoptotic blebbs were observed (marked with arrows). Scale bar represents 10 μm. C, PARP1 cleavage upon treatment with TpeL. HeLa cells were treated with staurosporine (1 μm) or were left untreated, or were intoxicated with increasing concentrations of TpeL (as indicated) overnight at 37 °C. The next day, cells were lysed, followed by SDS-PAGE of whole cell lysate proteins and PARP1 immunoblotting for the detection of PARP1 cleavage products. Equal loading of samples was monitored by the detection of GAPDH.
FIGURE 6.
FIGURE 6.
Substrate specificity of TpeL in living cells. A, HeLa cells were intoxicated with lethal toxin, toxin A (each 1 nm) or with increasing concentrations of TpeL (as indicated) overnight at 37 °C. The next day, cells were lysed, followed by SDS-PAGE of whole cell lysate proteins and immunoblotting for the detection of Ras and Rac with glucosylation-sensitive antibodies (input control; total Ras or Rac, respectively) or with glucosylation-insensitive antibodies (non-glucosylated Ras or Rac, respectively). B, TpeL modifies Ras in living cells by GlcNAcylation. HeLa cells were intoxicated with TpeL (10 nm) overnight at 37 °C, followed by lysis of cells and immunoprecipitation of Ras with a Ras-specific antibody. Following SDS-PAGE, the protein band corresponding to Ras was excised and analyzed by tandem mass spectrometry. The extracted ion chromatogram of the GlcNAc-modified peptide (acq. time: 10.6 min, m/z = 480.5719 (3+)) is shown.
FIGURE 7.
FIGURE 7.
Effects of TpeL intoxication on Ras signaling. A, functional consequence of the glucosylation of Ras by TpeL. HeLa cells were intoxicated with lethal toxin, toxin A (each 1 nm) or TpeL (10 nm) overnight at 37 °C. Following cell lysis, equal amounts of whole cell lysate proteins were separated by SDS-PAGE and Ras was detected by immunoblotting (input control; upper panel). Glutathione-Sepharose beads coated with GST-Raf-1-RBD were used for pull down of endogenous Ras from whole-cell lysate proteins of intoxicated cells. Precipitated Ras-GTP was then detected by immunoblotting (lower panel). B, influence of TpeL on ERK1/2 phosphorylation. Starved HeLa cells were intoxicated with lethal toxin, toxin A (each 1 nm) or with increasing concentrations of TpeL (as indicated) overnight at 37 °C. The next day, cells were stimulated by the addition of EGF (10 ng/ml) for 3 min at 37 °C. Finally, cells were lysed, followed by SDS-PAGE of whole-cell lysate proteins and immunoblotting for the detection of phosphorylated ERK1/2. Equal loading of samples was monitored by the detection of GAPDH. C, neurite formation in PC-12 cells was stimulated by adding 100 ng/ml NGF, prior to intoxication of cells with the indicated concentrations of TpeL for 2 days at 37 °C. In parallel samples, PC12 cells were either not treated with toxin and NGF (w/o toxin and w/o NGF) or were treated only with NGF (w/o toxin +NGF). Then, actin cytoskeleton of PC12 cells was stained with TRITC-phalloidin to visualize cell morphology and neurite formation of PC12 cells by fluorescence microscopy. D, quantification of the neurite formation from PC12 cells shown in C. For each represented bar (S.E., n = 3), a minimum of 100 cells was analyzed. Cells with neurites with at least the length of the cell diameter were regarded as positive. The number of non-intoxicated, NGF-stimulated cells producing neurites was set to 1.0 (control). Shown is the relative number of cells with neurite formation in comparison to the control.

Similar articles

Cited by

References

    1. Borriello S. P., Aktories K. (2005) in Clostridium perfringens, Clostridium difficile, and other Clostridium species, Topley Wilson's Microbiology & Microbial Infections (Borriello S. P., Murray P. R., Funke G., eds) Hodder Arnold, London
    1. Hatheway C. L. (1990) Toxigenic clostridia. Clin. Microbiol. Rev. 3, 66–98 - PMC - PubMed
    1. Smedley J. G., 3rd, Fisher D. J., Sayeed S., Chakrabarti G., McClane B. A. (2004) The enteric toxins of Clostridium perfringens. Rev. Physiol Biochem. Pharmacol. 152, 183–204 - PubMed
    1. Rood J. I., Cole S. T. (1991) Molecular genetics and pathogenesis of Clostridium perfringens. Microbiol. Rev. 55, 621–648 - PMC - PubMed
    1. Rood J. I. (1998) Virulence genes of Clostridium perfringens. Annu. Rev. Microbiol. 52, 333–360 - PubMed

Publication types

MeSH terms