. 2012 Aug;32(16):3190-202.
doi: 10.1128/MCB.00159-12. Epub 2012 Jun 4.

The stress response mediator ATF3 represses androgen signaling by binding the androgen receptor

Affiliations

The stress response mediator ATF3 represses androgen signaling by binding the androgen receptor

Hongbo Wang et al. Mol Cell Biol. 2012 Aug.

Abstract

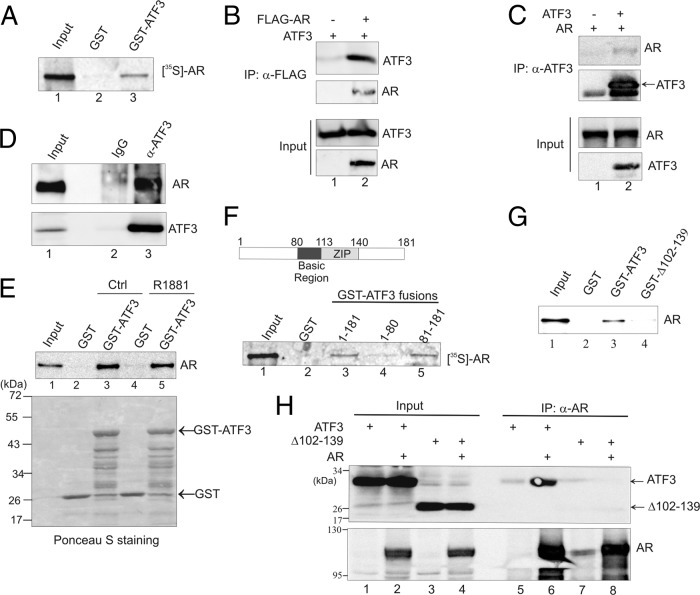
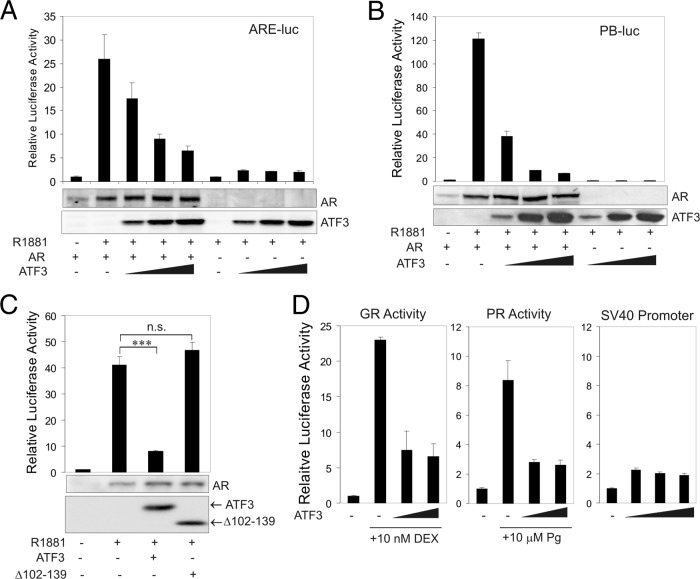
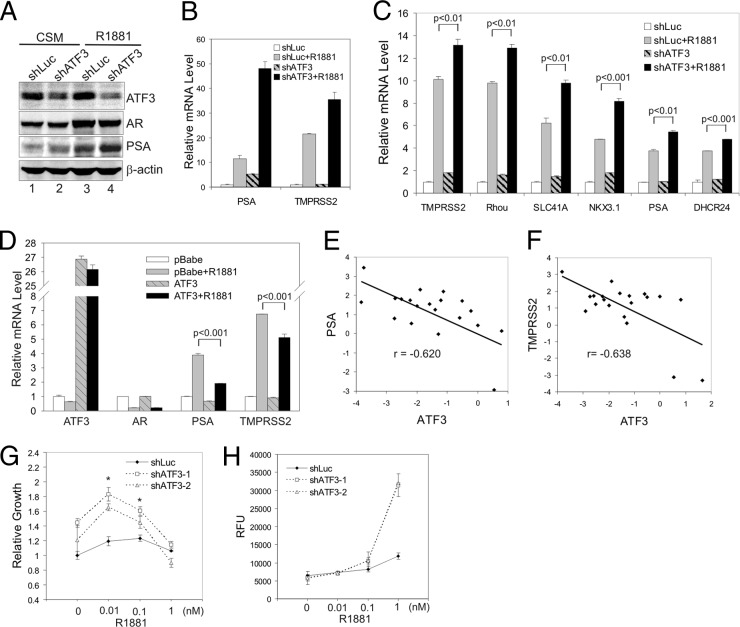
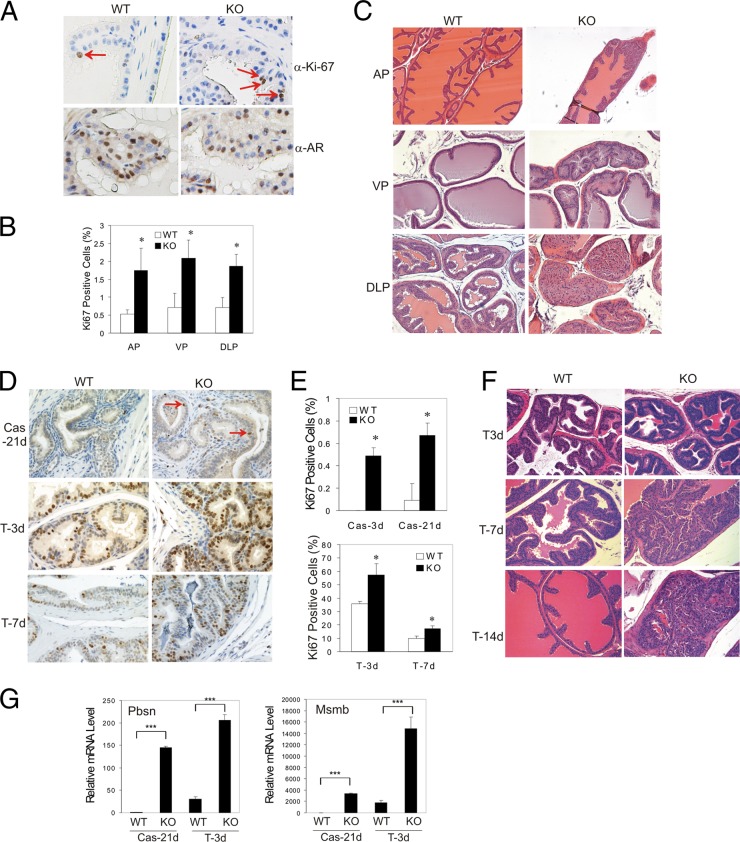
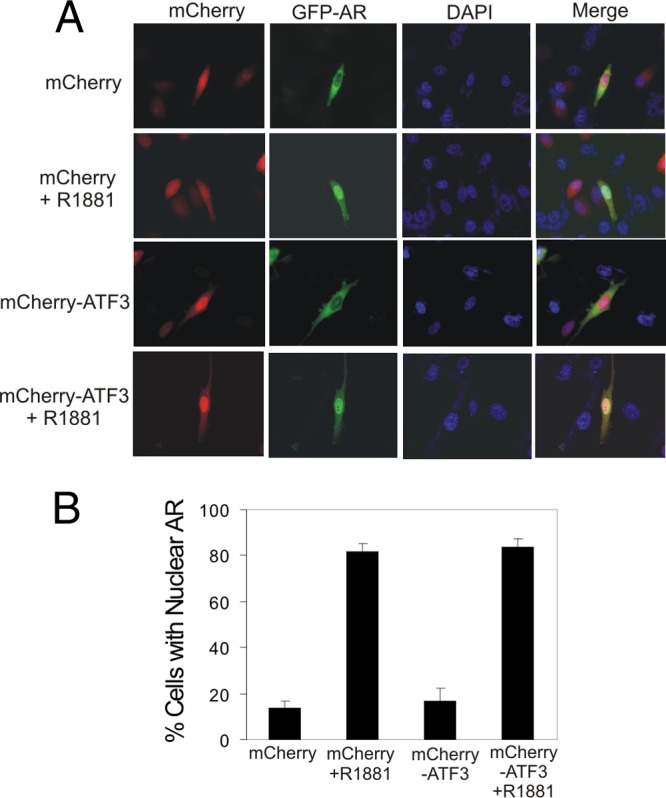
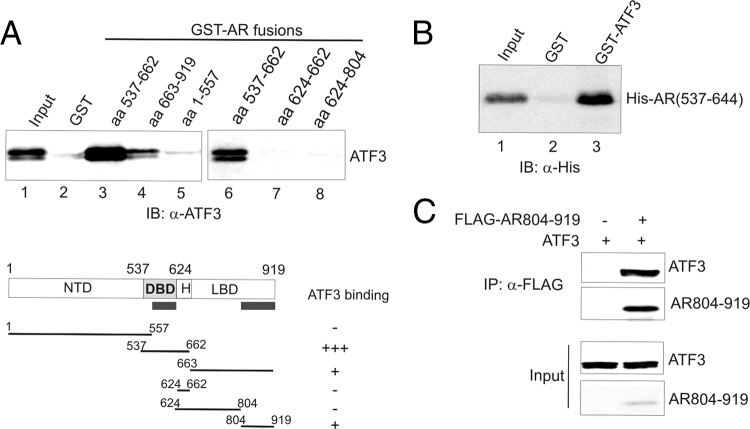
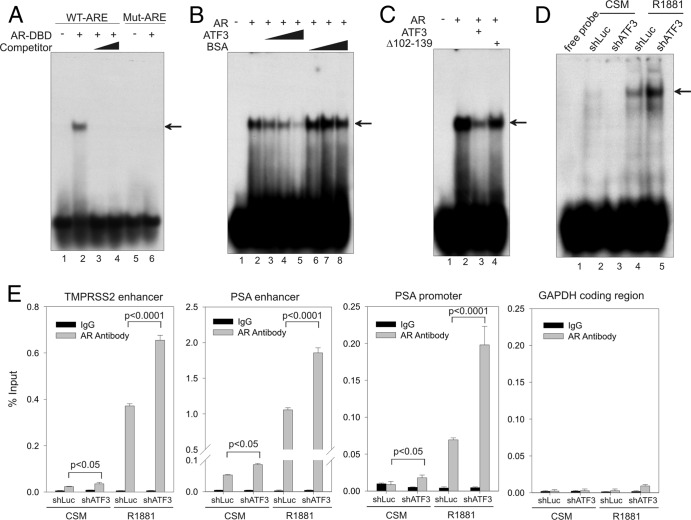
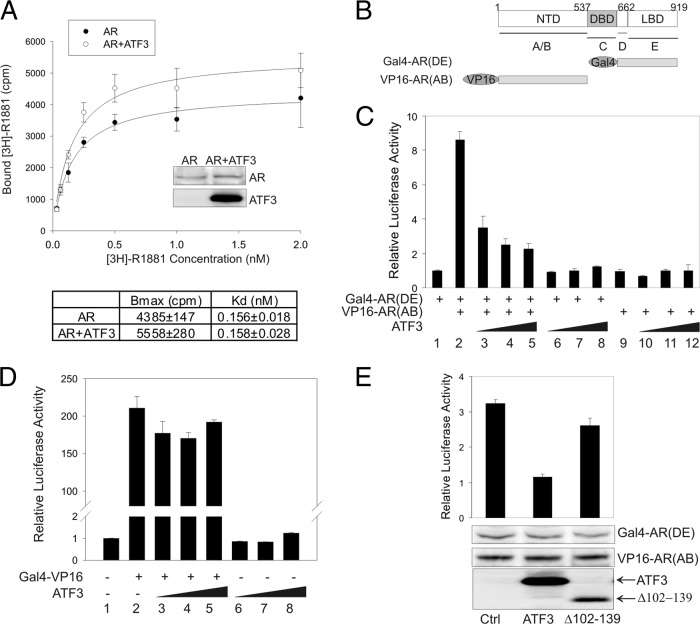
Activating transcription factor 3 (ATF3) is a common mediator of cellular stress response signaling and is often aberrantly expressed in prostate cancer. We report here that ATF3 can directly bind the androgen receptor (AR) and consequently repress AR-mediated gene expression. The ATF3-AR interaction requires the leucine zipper domain of ATF3 that independently binds the DNA-binding and ligand-binding domains of AR, and the interaction prevents AR from binding to cis-acting elements required for expression of androgen-dependent genes while inhibiting the AR N- and C-terminal interaction. The functional consequences of the loss of ATF3 expression include increased transcription of androgen-dependent genes in prostate cancer cells that correlates with increased ability to grow in low-androgen-containing medium and increased proliferative activity of the prostate epithelium in ATF3 knockout mice that is associated with prostatic hyperplasia. Our results thus demonstrate that ATF3 is a novel repressor of androgen signaling that can inhibit AR functions, allowing prostate cells to restore homeostasis and maintain integrity in the face of a broad spectrum of intrinsic and environmental insults.


Figures

Fig 1
Fig 1
ATF3 interacts with AR via its ZIP domain. (A) GST-ATF3 or GST was immobilized onto glutathione-agarose and incubated with AR labeled with [35S]methionine by in vitro translation. After extensive washes, bound proteins were eluted and visualized by electrophoresis followed by fluorography. (B) PC3 cells were transfected with the indicated plasmids and then subjected to co-IP using anti-FLAG antibody. Precipitated proteins were detected by Western blotting. (C) AR was coexpressed with or without ATF3 in PC3 cells by transfections. Cell lysates were subjected to co-IP using anti-ATF3 antibody followed by Western blotting. (D) LNCaP cell lysates were incubated with anti-ATF3 antibody or rabbit IgG at 4°C overnight and then precipitated with protein A-agarose. Bound proteins were eluted and subjected to Western blotting. (E) In vitro-translated AR was preincubated with or without 100 nM R1881 for 1 h and then subjected to GST pulldown assays to examine the ATF3-AR interaction. (F) The indicated GST-ATF3 fusions were incubated with 35S-labeled AR and subjected to GST pulldown assays. (G) The full-length ATF3 and a mutant lacking the ZIP domain (Δ102–139) were fused to GST and incubated with in vitro-translated AR for GST pulldown assays. Bound proteins were detected by Western blotting with the anti-AR antibody. (H) ATF3 or ATF3 Δ102–139 was coexpressed with or without AR in PC3 cells and then subjected to co-IP assays with anti-AR antibody, followed by Western blotting. α, anti.
Fig 2
Fig 2
ATF3 represses the transactivation activity of AR. (A) PC3 cells were cotransfected with ARE-Luc, pRL-CMV (where CMV is cytomegalovirus), AR, and/or increasing amounts of ATF3 in charcoal-stripped medium for 1 day and then treated with 1 nM R1881 for dual luciferase activity assays. AR and ATF3 expression levels were determined by Western blotting after normalization using the Renilla luciferase activity. Data are depicted as averages ± standard deviations of three determinations. (B) PC3 cells were cotransfected with PB-Luc, pRL-CMV, AR, and/or increasing amounts of ATF3 for dual luciferase activity assays. Immunoblots show expression levels of AR and ATF3. Data are depicted as averages ± standard deviations of three determinations. (C) PC3 cells were cotransfected with PB-Luc, pRL-CMV, ATF3, or ATF3 Δ102–139 for dual luciferase activity assays. Data are depicted as averages ± standard deviations of three determinations. ns, not significant. (D) In the experiments shown in the left and middle graphs, PC3 cells were cotransfected with ARE-Luc, pRL-CMV, GR, or PR and/or increasing amounts of ATF3 in charcoal-stripped medium for 1 day and then treated with 10 nM dexamethasone (DEX) or 10 μM progesterone (Pg) for 1 day for dual luciferase activity assays. In the experiment shown in the right graph, PC3 cells were cotransfected with pGL3-promoter (containing the SV40 promoter), pRL-CMV, and/or increasing amounts of ATF3 for dual-luciferase activity assays. Data are depicted as averages ± standard deviations of three determinations.
Fig 3
Fig 3
ATF3 represses androgen signaling in prostate cancer cells. (A and B) LNCaP cells were infected with lentiviruses expressing shATF3 or shLuc and selected with puromycin for 4 weeks. A clone stably expressing shATF3 was cultured in CSM for 2 days, treated with 1 nM R1881 for 24 h, and then lysed for Western blotting (A) or qRT-PCR assays (B). Data are depicted as averages ± standard deviations of three determinations. (C) LNCaP cells were infected with shATF3-expressing lentiviruses for 2 days, followed by being cultured in CSM for 2 days and then treated with 1 nM R1881 for 24 h. Cells were lysed for qRT-PCR assays to measure mRNA levels of indicated androgen-dependent genes. Data are depicted as averages ± standard deviations of three determinations. (D) VCaP cells infected with retroviruses expressing ATF3 or empty vector (pBabe) were cultured in CSM for 2 days, followed by treatments with 1 nM R1881 for 1 day. Levels of the indicated mRNAs were measured by qRT-PCR. Data are depicted as averages ± standard deviations of three determinations. (E and F) A qRT-PCR tissue array was used to measure ATF3, PSA, and TMPRSS2 mRNA levels in human prostate cancer samples (n = 20). Relative mRNA levels were converted to logarithms (log2) and plotted for each sample. A linear regression line and Pearson's correlation (r) are shown for each graph. (G) LNCaP cells infected with lentiviruses expressing ATF3-specific shRNA (shATF3-1 and shATF3-2) or shLuc were cultured in CSM for 2 days. Various amounts of R1881 were added on days 0, 3, 6, and 9, and numbers of viable cells were measured on day 10 by MTT [3-(4,5-dimethylthiazol-2-yl)2 2,5-diphenyl tetrazolium bromide] assays. Data are depicted as averages ± standard deviations of three determinations. (H) LNCaP cells expressing shATF3 or shLuc were cultured in CSM for 2 days, followed by treatments with R1881. Levels of cellular lipids were measured by AdipoRed assays. Data are depicted as averages ± standard deviations of three determinations. RFU, relative fluorescence units.
Fig 4
Fig 4
ATF3 deficiency promotes prostate epithelial proliferation in mice. (A) Anterior prostates of ATF3 wild-type (WT) and knockout (KO) mice (8 weeks of age) were embedded in paraffin, sectioned, and stained for Ki-67 or AR expression. Arrows indicate Ki-67-positive cells. (B) At least 1,000 luminal cells of anterior prostates (AP), ventral prostates (VP), or dorso-lateral prostates (DLP) of ATF3 WT and KO mice were counted for Ki-67 positivity under a microscope (random ×20 fields). Data are depicted as averages ± standard deviations of three determinations. *, P < 0.05, Student t test (n = 3). (C) Prostates of WT and ATF3 KO mice were subjected to hematoxylin and eosin staining. (D, E, and F) ATF3 WT and KO mice were castrated for 21 days, followed by subcutaneous injections of 40 mg/kg testosterone for 14 days. Prostates were sectioned and stained for Ki-67 expression (D). Ki-67-positive epithelial cells in anterior prostates were counted, and the results are shown in panel E. Hematoxylin and eosin staining of representative AP sections is shown in panel F. Data are depicted as averages ± standard deviations of three determinations. *, P < 0.05, Student t test (n = 3). (G) Ventral prostates were dissected for RNA preparation and used for qRT-PCR assays for AR target gene expression. Data are depicted as averages ± standard deviations of three determinations. ***, P < 0.001, Student t test.
Fig 5
Fig 5
ATF3 does not affect nuclear translocation of AR. PC3 cells were cotransfected with GFP-AR with mCherry-ATF3 or mCherry and then cultured in CSM for 2 days followed by treatments with 1 nM R1881 for 1 h. Cells were then fixed with paraformaldehyde, stained with DAPI (4′,6′-diamidino-2-phenylindole), and observed under a fluorescence microscope (A). At least 300 GFP/mCherry-positive cells were counted for nuclear AR localization (B). Data are depicted as averages ± standard deviations of three determinations.
Fig 6
Fig 6
ATF3 binds AR at the DBD and LBD regions. (A) Indicated GST-AR fusion proteins were incubated with in vitro-translated ATF3 and subjected to GST pulldown assays. (B) A histidine-tagged AR fragment (aa 537 to 644) containing the DBD was purified by NTA-Ni+-agarose and incubated with immobilized GST-ATF3 or GST for GST pulldown assays. (C) ATF3 was coexpressed with or without FLAG-AR804–919 in PC3 cells by transfections. Cell lysates were subjected to co-IP assays with anti-FLAG antibody.
Fig 7
Fig 7
ATF3 prevents AR from binding to ARE both in vitro and in vivo. (A) The purified AR-DBD protein (aa 537 to 644; 500 ng) was incubated with 32P-labeled oligonucleotide containing ARE derived from the PSA enhancer (lanes 1 to 4) or a mutated oligonucleotide (lanes 5 and 6) and subjected to gel shift assays. For competition assays (lanes 3 and 4), 50-fold and 100-fold amounts of unlabeled oligonucleotide were mixed with labeled oligonucleotide and AR-DBD protein. The arrow indicates the AR-ARE binding complex. (B) Increasing amounts of purified ATF3 proteins (100, 200, and 500 ng) or BSA were preincubated with AR-DBD protein at 4°C for 30 min and then subjected to gel shift assays. The arrow indicates the AR-DNA complex. (C) An equal amount (500 ng) of ATF3 or the ATF3 Δ102–139 mutant was preincubated with the AR-DBD protein for gel shift assays. The arrow indicates the AR-DNA complex. (D) LNCaP cells stably expressing shATF3 or shLuc were cultured in CSM for 2 days and then treated with 1 nM R1881 for 24 h. Nuclear extracts were prepared and incubated with 32P-labeled oligonucleotide as described for panel A. The main AR-DNA binding band is indicated by the arrow. (E) LNCaP cells expressing shATF3 or shLuc were treated as described for panel D and then fixed with formaldehyde for ChIP assays using anti-AR antibody or control IgG. Real-time PCR was used to quantify amounts of DNA fragments spanning the ARE in the TMPRSS2 enhancer, the PSA enhancer, or the PSA proximal promoter, as indicated. For specificity control, a random fragment in the GAPDH coding region was also amplified and quantified by real-time PCR. Data are depicted as averages ± standard deviations of three determinations. The P values were calculated using the Student t test.
Fig 8
Fig 8
ATF3 does not affect the AR-androgen interaction but inhibits the AR N-C interaction. (A) PC3 cells cotransfected with AR and/or ATF3 were cultured in charcoal-stripped medium for 2 days and then incubated with the indicated amounts of [3H]R1881 for 2 h. After extensive washing, bound [3H]R1881 was extracted with methanol, and extract solutions were subjected to scintillation counting. Nonlinear regression was used to calculate Bmax and Kd. Inserted blots show AR expression levels. (B) Diagram representing the AR fragments used in the mammalian two-hybrid assay. (C) PC3 cells were transfected with Gal4-Luc, pRL-TK, Gal4-AR(DE), VP16-AR(AB), and/or increasing amounts of ATF3 in charcoal-stripped medium and then treated with 1 nM R1881 for 1 day for dual luciferase activity assays. Data are depicted as averages ± standard deviations of three determinations. (D) PC3 cell were transfected with Gal4-Luc, Gal4-VP16 (in pBIND), and/or increasing amounts of ATF3 as indicated for dual luciferase activity assays. Data are depicted as averages ± standard deviations of three determinations. (E) PC3 cells were transfected with Gal4-Luc, pRL-TK, Gal4-AR(DE), VP16-AR(AB), ATF3, or Δ102–139 for dual luciferase activity assays. Expression of the AR fragments and ATF3 and Δ102–139 was determined by Western blotting. Data are depicted as averages ± standard deviations of three determinations.

Similar articles

Cited by

References

    1. Adachi M, et al. 2000. Androgen-insensitivity syndrome as a possible coactivator disease. N. Engl. J. Med. 343:856–862 - PubMed
    1. Andersen R, et al. 2010. Regression of castrate-recurrent prostate cancer by a small-molecule inhibitor of the amino-terminus domain of the androgen receptor. Cancer Cell 17:535–546 - PubMed
    1. Beleza-Meireles A, et al. 2008. Activating transcription 3: a hormone responsive gene in the etiology of hypospadias. Eur. J. Endocrinol. 158:729–739 - PubMed
    1. Best CJM, et al. 2005. Molecular alterations in primary prostate cancer after androgen ablation therapy. Clin. Cancer Res. 11:6823–6834 - PMC - PubMed
    1. Brinkmann AO. 2001. Molecular basis of androgen insensitivity. Mol. Cell Endocrinol. 179:105–109 - PubMed

Publication types