. 2012 Jun 11;197(6):721-9.
doi: 10.1083/jcb.201201003. Epub 2012 Jun 4.

2D protrusion but not motility predicts growth factor-induced cancer cell migration in 3D collagen

Affiliations

2D protrusion but not motility predicts growth factor-induced cancer cell migration in 3D collagen

Aaron S Meyer et al. J Cell Biol. .

Abstract

Growth factor-induced migration is a critical step in the dissemination and metastasis of solid tumors. Although differences in properties characterizing cell migration on two-dimensional (2D) substrata versus within three-dimensional (3D) matrices have been noted for particular growth factor stimuli, the 2D approach remains in more common use as an efficient surrogate, especially for high-throughput experiments. We therefore were motivated to investigate which migration properties measured in various 2D assays might be reflective of 3D migratory behavioral responses. We used human triple-negative breast cancer lines stimulated by a panel of receptor tyrosine kinase ligands relevant to mammary carcinoma progression. Whereas 2D migration properties did not correlate well with 3D behavior across multiple growth factors, we found that increased membrane protrusion elicited by growth factor stimulation did relate robustly to enhanced 3D migration properties of the MDA-MB-231 and MDA-MB-157 lines. Interestingly, we observed this to be a more reliable relationship than cognate receptor expression or activation levels across these and two additional mammary tumor lines.


Figures
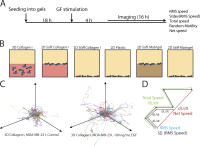
Figure 1.
Figure 1.
Schematic of the migration assays. (A) Schematic of the migration assay protocol. (B) Cells were seeded on or in matrix or on plastic for 18 h before growth factor stimulation. 4 h after growth factor stimulation, cells were imaged for 16 h. Arrows show cell movement. (C and D) Tracks of each cell were produced (C) and used to calculate five parameters summarizing the migration phenotype of each cell (D). dL/dt, change in length over time.
Figure 2.
Figure 2.
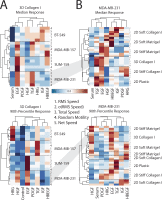
Large-scale quantification of migration responses enables systems analysis of migration. (A and B) Shown are mean-centered motility responses across eight growth factor conditions and four cell lines within collagen I gels (A) or MDA-MB-231 cells across different 2D and 3D motility assays (B; also see Fig. 1 B). Each profile and growth factor is clustered by rank correlation and mean linkage. Both the median (top) and 90th quantile (bottom) responses are shown as well as each migration metric (indicated by numbers). IGF, insulin-like growth factor 1; HRG, Heregulin β1; HBEGF, heparin-binding EGF-like growth factor; HGF, hepatocyte growth factor.
Figure 3.
Figure 3.
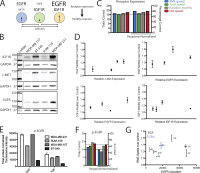
Cognate receptor measurement is weakly informative of relative growth factor motility enhancement. (A) Illustration of the pairwise comparison of receptor measurement and motility enhancement made between each cell line. (B) EGFR, IGF1R, and c-Met expression was measured across four cell lines. Lines separate loading controls from a different portion of the same membrane. Thin lines indicate portions of a membrane shown from a separate channel on the same membrane, position, and scan. (C) Every pairwise comparison of receptor expression and motility enhancement was made between cell lines for each metric of motility. Additionally, the motility enhancement for each cell line across all growth factor conditions was used to normalize for differences in the ability of each cell line to globally respond by migrating. The left and right y axes indicate the number and percentage of correct comparisons, respectively. Significance was tested by use of the binomial distribution (dotted line, P < 0.05). Migration measurements are the mean of at least three independent experiments. (D) Plots of RMS speed enhancement upon receptor stimulation versus relative receptor expression. Error bars indicate SEM from at least three independent experiments. (E) EGFR pan-pY measurement in cells stimulated with either EGF or TGF-α for 5 min. Error bars indicate the range of duplicate measurements. (F) Similar pairwise comparison analysis using measurement of p-EGFR to predict migration response. Migration measurements are the mean of at least three independent experiments. The continuous line indicates the maximum likelihood outcome of random chance. The dotted line indicates the P < 0.05 threshold. (G) Plot of RMS speed enhancement upon EGFR stimulation versus EGFR pan-pY measurement. Vertical error bars indicate SEM of at least three independent experiments; horizontal error bars indicate the range of duplicate measurements. Numbers refer to different cell lines.
Figure 4.
Figure 4.
Motility enhancement in 2D and 3D in MDA-MB-231 is broadly distinct. (A) All Spearman pairwise correlation coefficients between each motility metric in each 2D and 3D migration assay across growth factor stimuli. The top and bottom diagonals show coefficients corresponding to the median and 90th percentile response profiles, respectively. Arrows show cell movement. (B) Significant correlations (P < 0.05) are indicated in black. Correlations are observed along the diagonal between motility metrics but not between different migration assays and 3D migration.
Figure 5.
Figure 5.
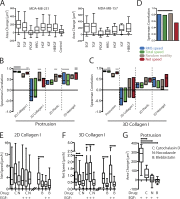
Protrusion correlates specifically with 3D motility enhancement. (A) MDA-MB-231 and MDA-MB-157 cells were stimulated with each growth factor condition, and the fold change in cell area was calculated by manual tracing of DIC images (MDA-MB-231, n = 60–138; MDA-MB-157, n = 15–25 from at least three independent experiments). (B) Rank correlation coefficients were calculated for MDA-MB-231 between the median, 90th percentile, and 95th percentile protrusion responses and the migration responses across different metrics of migration and assays. Each box is bounded by the highest and lowest correlation calculated, with a line indicating the median correlation calculated. Bars on the top indicate the number of quantiles for which the correlation is significant (Storey correction, q < 0.05; 0.75 false positive). (C) Similar analysis shows correlations between 3D motility and protrusion or different 2D motility assays (q < 0.05; 0.2 false positive). (D) Protrusion and 3D motility also correlate in MDA-MB-157 cells. Bar indicates correlations that are significantly nonzero (P < 0.05). (E) Net displacement of MDA-MB-231 cells treated with three cytoskeleton-related inhibitors with or without EGF stimulation on stiff collagen matrix. (F) Net displacement of cells treated similarly within 3D collagen gels. (G) Protrusion in response to EGF stimulation for cells treated with each cytoskeletal drug. For inhibitor experiments, a single representative experiment is shown. An independent replicate showed qualitatively identical results but was not quantified. (E–G) Bars on the top indicate significant differences with respect to the no inhibitor control (P < 0.05). (A and E–G) The lines indicate the median. The box is bound by the 25th and 75th quantiles. The whiskers extend to either the maximum and minimum values or three halves the interquartile range, depending on which is closer to the median. IGF, insulin-like growth factor 1; HRG, Heregulin β1; HBEGF, heparin-binding EGF-like growth factor; HGF, hepatocyte growth factor.

References

    1. Al-Hajj M., Wicha M.S., Benito-Hernandez A., Morrison S.J., Clarke M.F. 2003. Prospective identification of tumorigenic breast cancer cells. Proc. Natl. Acad. Sci. USA. 100:3983–3988 10.1073/pnas.0530291100 - DOI - PMC - PubMed
    1. Bear J.E., Svitkina T.M., Krause M., Schafer D.A., Loureiro J.J., Strasser G.A., Maly I.V., Chaga O.Y., Cooper J.A., Borisy G.G., Gertler F.B. 2002. Antagonism between Ena/VASP proteins and actin filament capping regulates fibroblast motility. Cell. 109:509–521 10.1016/S0092-8674(02)00731-6 - DOI - PubMed
    1. Bernards R., Weinberg R.A. 2002. A progression puzzle. Nature. 418:823 10.1038/418823a - DOI - PubMed
    1. Charafe-Jauffret E., Ginestier C., Monville F., Finetti P., Adélaïde J., Cervera N., Fekairi S., Xerri L., Jacquemier J., Birnbaum D., Bertucci F. 2006. Gene expression profiling of breast cell lines identifies potential new basal markers. Oncogene. 25:2273–2284 10.1038/sj.onc.1209254 - DOI - PubMed
    1. Cheng N., Bhowmick N.A., Chytil A., Gorksa A.E., Brown K.A., Muraoka R., Arteaga C.L., Neilson E.G., Hayward S.W., Moses H.L. 2005. Loss of TGF-β type II receptor in fibroblasts promotes mammary carcinoma growth and invasion through upregulation of TGF-α-, MSP- and HGF-mediated signaling networks. Oncogene. 24:5053–5068 10.1038/sj.onc.1208685 - DOI - PMC - PubMed

Publication types