. 2012 Jun 19;109(25):9929-34.
doi: 10.1073/pnas.1206694109. Epub 2012 Jun 4.

Direct reciprocity in structured populations

Affiliations

Direct reciprocity in structured populations

Matthijs van Veelen et al. Proc Natl Acad Sci U S A. .

Abstract

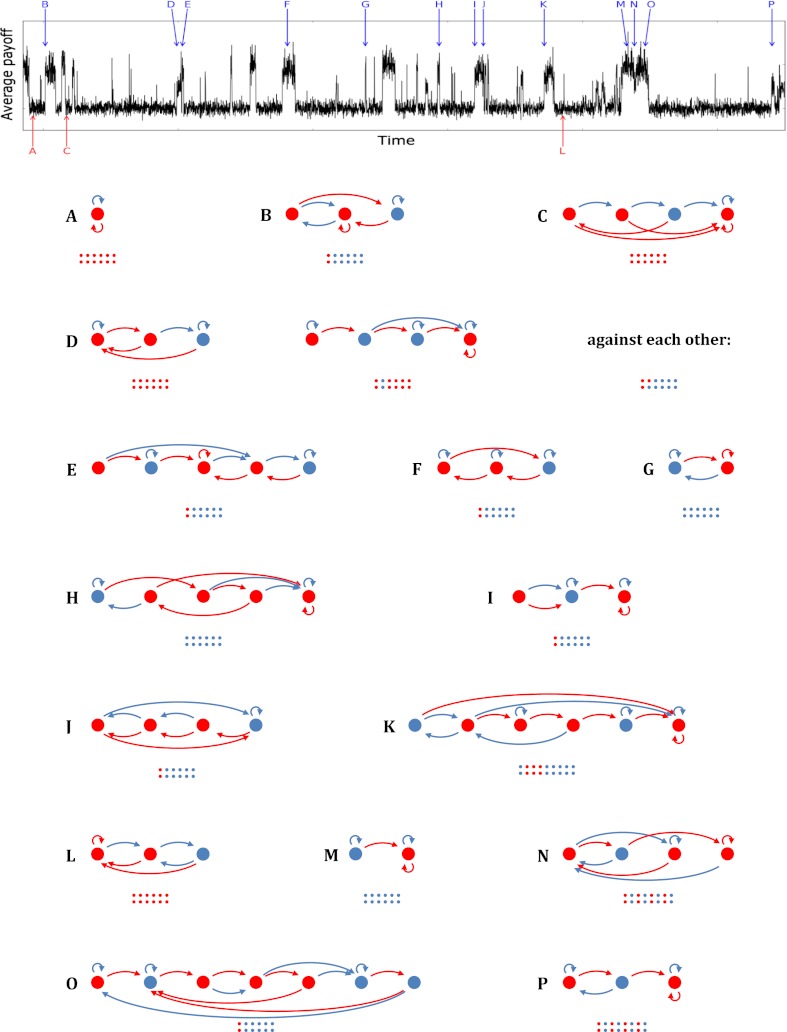
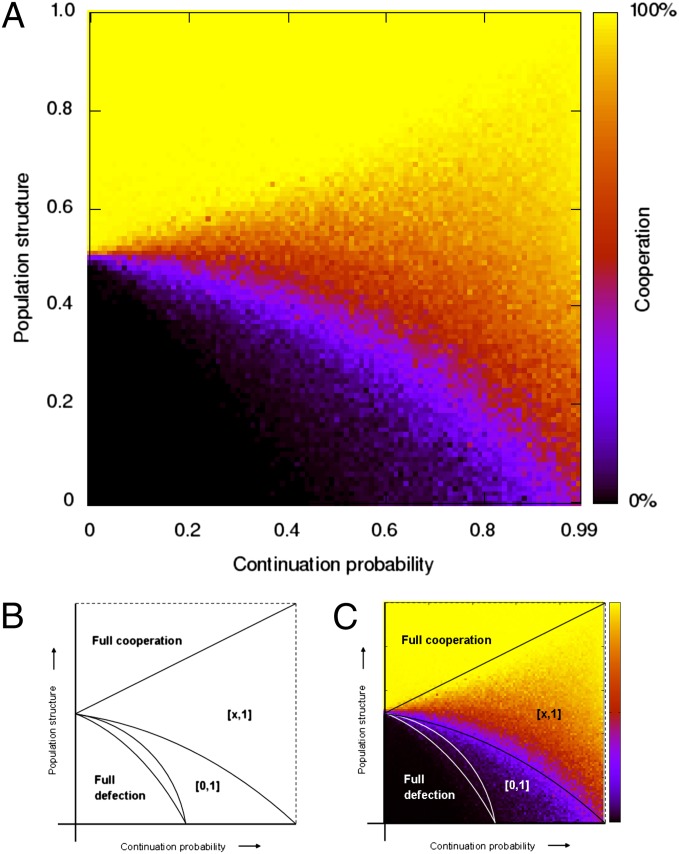
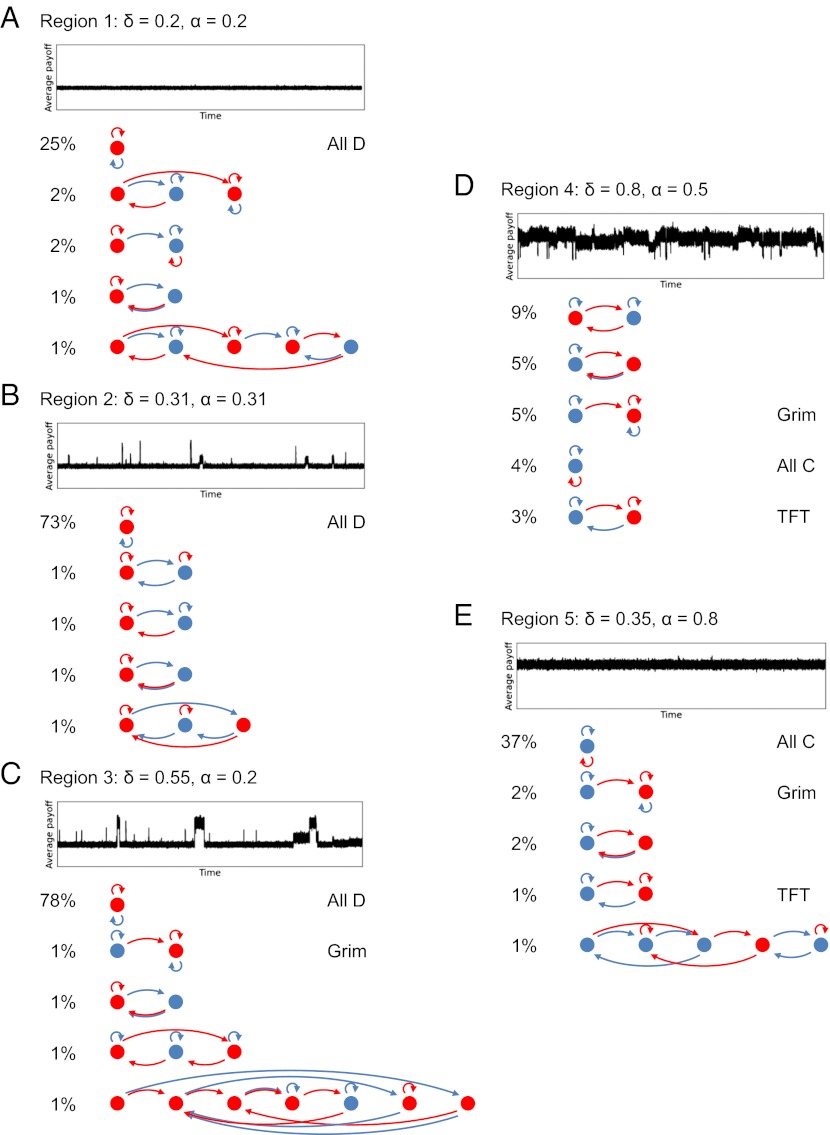
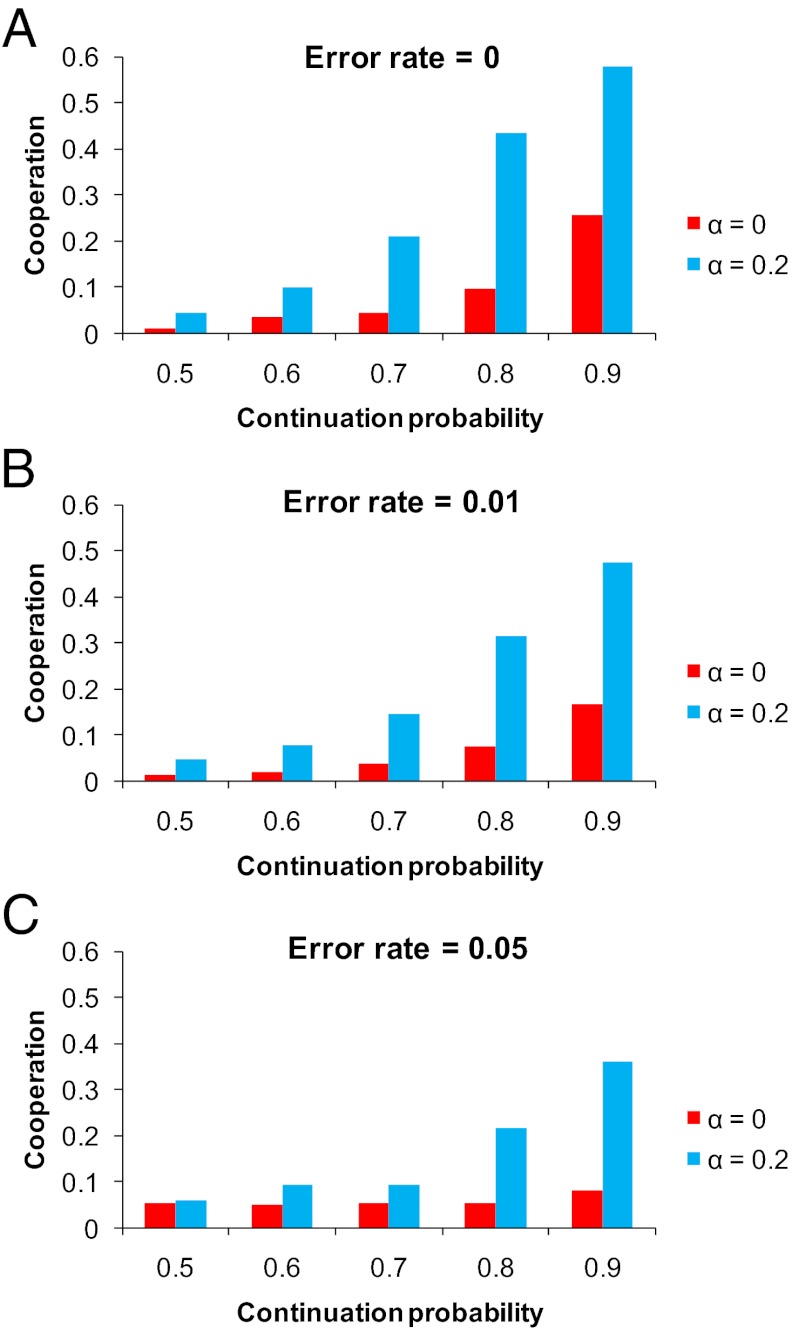
Reciprocity and repeated games have been at the center of attention when studying the evolution of human cooperation. Direct reciprocity is considered to be a powerful mechanism for the evolution of cooperation, and it is generally assumed that it can lead to high levels of cooperation. Here we explore an open-ended, infinite strategy space, where every strategy that can be encoded by a finite state automaton is a possible mutant. Surprisingly, we find that direct reciprocity alone does not lead to high levels of cooperation. Instead we observe perpetual oscillations between cooperation and defection, with defection being substantially more frequent than cooperation. The reason for this is that "indirect invasions" remove equilibrium strategies: every strategy has neutral mutants, which in turn can be invaded by other strategies. However, reciprocity is not the only way to promote cooperation. Another mechanism for the evolution of cooperation, which has received as much attention, is assortment because of population structure. Here we develop a theory that allows us to study the synergistic interaction between direct reciprocity and assortment. This framework is particularly well suited for understanding human interactions, which are typically repeated and occur in relatively fluid but not unstructured populations. We show that if repeated games are combined with only a small amount of assortment, then natural selection favors the behavior typically observed among humans: high levels of cooperation implemented using conditional strategies.


Conflict of interest statement

The authors declare no conflict of interest.

Figures

Fig. 1.
Fig. 1.
Examples of equilibrium strategies observed during a simulation run. The top part of the figure depicts the average payoff during a part of a simulation run with continuation probability 0.85. The payoffs in the stage game are 2 for both players if they both cooperate, 1 for both if they both defect, and 3 for the defector and 0 for the cooperator if one defects and the other cooperates. These payoffs imply a benefit-to-cost ratio of b/c = 2. Because the game lengths are stochastic, there is variation in average payoff, even when the population makeup is constant. The different payoff plateaus indicate the population visiting different equilibria with different levels of cooperation and hence different expected average payoffs. Examples of equilibrium strategies, indicated by letters A through P, are also shown in the following way. The circles are the states and their colors indicate what this strategy plays when in that state; a blue circle means that the strategy will cooperate and a red one means that it will defect. The arrows reflect to which state this strategy goes, depending on the action played by its opponent; the blue arrows indicate where it goes if its opponent cooperates, the red ones where it goes if its opponent defects. The strategies all start in the leftmost state. The small colored dots indicate what the first few moves are if the strategy plays against itself, and in a mixture (case D) also what the two strategies play when they meet each other. The strategies vary widely in the ways in which they are reciprocal, the extent to which they are forgiving, the presence or absence of handshakes they use before they start cooperating, and the level of cooperation. The strategies shown here are discussed in greater detail in the SI Appendix.
Fig. 2.
Fig. 2.
Simulation results and theoretical prediction with repetition as well as assortment. (A) Every pixel represents a run of 500,000 generations, where every individual in every generation plays a repeated game once. The population size is 200 and the benefit-to-cost ratio is b/c = 2. The continuation probability δ (horizontal axis) indicates the probability with which a subsequent repetition of the stage game between the two players occurs. Therefore, a high continuation probability means that in expectation the game is repeated a large number of times and a continuation probability of 0 implies that the game is played exactly once. On the vertical axis we have a parameter α for the assortment introduced by population structure, which equals the probability with which a rare mutant meets another individual playing the same strategy, and that can also be interpreted as relatedness (21, 29, 41, 42). This parameter being 0 would reflect random matching. If it is 1, then every individual always interacts with another individual playing the same strategy. Both parameters—continuation probability δ and assortment α—are varied in steps of 0.01, which makes 10,100 runs in total. (B and C) A theoretical analysis with an unrestricted strategy space explains what we find in the simulations. This analysis divides the parameter space into five regions, as described in the main text (see the SI Appendix for a detailed analysis and a further subdivision). The border between regions 3 and 4 is an especially important phase transition, because above that line, fully defecting strategies no longer are equilibria. In the lower-right corner, where continuation probability is close to 1, adding only a little bit of population structure moves us across that border.
Fig. 3.
Fig. 3.
Runs and top five strategies from the five regions. Each panel (A–E) shows simulation results using a (δ, α) pair taken from the center of the corresponding region of Fig. 2. In each panel, the average payoff over time is shown, as well the five most frequently observed strategies. If any of the strategies have an established name, it is also given. The simulation runs confirm the dynamic behavior the theoretical analysis suggests. In region 1 (A) we only see fully defecting equilibria; all strategies in the top five—and actually almost all strategies observed—always defect when playing against themselves. In region 2 (B) we observe that indirect invasions get the population away from full defection sometimes, but direct or indirect invasions bring it back to full defection relatively quickly. In region 3 (C) we observe different equilibria, ranging from fully defecting to fully cooperative. In region 4 (D) we observe high levels of cooperation, and although cooperative equilibria are regularly invaded indirectly, cooperation is always re-established swiftly. Furthermore, most of the cooperative strategies we observe are conditional. In region 5 (E) we observe full cooperation, and strategies that always cooperate against themselves. By far the most common strategy is ALLC, which cooperates unconditionally. Note that the top five also contain disequilibrium strategies. Strategies 2, 3 and 4 in the top five of region 2 are neutral mutants to the most frequent strategy there (ALLD), and ALLC, which came in fourth in region 4, is a neutral mutant to all fully cooperative equilibrium strategies.
Fig. 4.
Fig. 4.
Simulation results with and without noise. (A–C) The simulations shown in Figs. 1–3 have no errors; individuals observe the actions of their opponent with perfect accuracy, and make no mistakes in executing their own actions. That is of course a stylized setting, and it is more reasonable to assume that in reality errors do occur (, , , –50). For five values of δ and two values of α we therefore repeat our simulations, but now with errors; once with an execution error of 1% per move, and once with an execution error of 5% per move. With errors, even ALLD against itself sometimes plays C, so the benchmark of no cooperation becomes the error rate, rather than 0. Errors decrease the evolution of cooperation somewhat, but the results do not change qualitatively. If anything, the effect of the combination of repetition and population structure is more pronounced; at an error rate of 5% both mechanisms have only a very small effect by themselves, but together make a big difference at sizable continuation probabilities.

References

    1. Friedman J. A noncooperative equilibrium for supergames. Rev Econ Stud. 1971;38:1–12.
    1. Fudenberg D, Maskin E. The folk theorem in repeated games with discounting or with incomplete information. Econometrica. 1986;54:533–554.
    1. Abreu D. On the theory of infinitely repeated games with discounting. Econometrica. 1988;56:383–396.
    1. Axelrod R, Hamilton WD. The evolution of cooperation. Science. 1981;211:1390–1396. - PubMed
    1. Selten R, Hammerstein P. Gaps in Harley’s argument on evolutionarily stable learning rules and in the logic of “tit for tat.”. Behav Brain Sci. 1984;7:115–116.

Publication types

LinkOut - more resources