Postnatal maturation of somatostatin-expressing inhibitory cells in the somatosensory cortex of GIN mice
- PMID: 22666189
- PMCID: PMC3364579
- DOI: 10.3389/fncir.2012.00033
Postnatal maturation of somatostatin-expressing inhibitory cells in the somatosensory cortex of GIN mice
Abstract
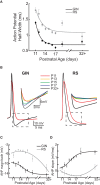
Postnatal inhibitory neuron development affects mammalian brain function, and failure of this maturation process may underlie pathological conditions such as epilepsy, schizophrenia, and depression. Furthermore, understanding how physiological properties of inhibitory neurons change throughout development is critical to understanding the role(s) these cells play in cortical processing. One subset of inhibitory neurons that may be affected during postnatal development is somatostatin-expressing (SOM) cells. A subset of these cells is labeled with green-fluorescent protein (GFP) in a line of mice known as the GFP-positive inhibitory neurons (GIN) line. Here, we studied how intrinsic electrophysiological properties of these cells changed in the somatosensory cortex of GIN mice between postnatal ages P11 and P32+. GIN cells were targeted for whole-cell current-clamp recordings and ranges of positive and negative current steps were presented to each cell. The results showed that as the neocortical circuitry matured during this critical time period multiple intrinsic and firing properties of GIN inhibitory neurons, as well as those of excitatory (regular-spiking [RS]) cells, were altered. Furthermore, these changes were such that the output of GIN cells, but not RS cells, increased over this developmental period. We quantified changes in excitability by examining the input-output relationship of both GIN and RS cells. We found that the firing frequency of GIN cells increased with age, while the rheobase current remained constant across development. This created a multiplicative increase in the input-output relationship of the GIN cells, leading to increases in gain with age. The input-output relationship of the RS cells, on the other hand, showed primarily a subtractive shift with age, but no substantial change in gain. These results suggest that as the neocortex matures, inhibition coming from GIN cells may become more influential in the circuit and play a greater role in the modulation of neocortical activity.
Keywords: inhibition; postnatal development; somatosensory cortex; somatostatin.
Figures


Similar articles
-
Selective, state-dependent activation of somatostatin-expressing inhibitory interneurons in mouse neocortex.J Neurophysiol. 2008 Nov;100(5):2640-52. doi: 10.1152/jn.90691.2008. Epub 2008 Sep 17. J Neurophysiol. 2008. PMID: 18799598 Free PMC article.
-
The roles of somatostatin-expressing (GIN) and fast-spiking inhibitory interneurons in UP-DOWN states of mouse neocortex.J Neurophysiol. 2010 Aug;104(2):596-606. doi: 10.1152/jn.00206.2010. Epub 2010 Jun 10. J Neurophysiol. 2010. PMID: 20538767 Free PMC article.
-
Electrophysiological classification of somatostatin-positive interneurons in mouse sensorimotor cortex.J Neurophysiol. 2006 Aug;96(2):834-45. doi: 10.1152/jn.01079.2005. Epub 2006 May 17. J Neurophysiol. 2006. PMID: 16707715
-
Characterizing the morphology of somatostatin-expressing interneurons and their synaptic innervation pattern in the barrel cortex of the GFP-expressing inhibitory neurons mouse.J Comp Neurol. 2020 Feb 1;528(2):244-260. doi: 10.1002/cne.24756. Epub 2019 Aug 24. J Comp Neurol. 2020. PMID: 31407339
-
Two Groups of eGFP-Expressing Neurons with Distinct Characteristics in the Neocortex of GIN Mice.Neuroscience. 2019 Apr 15;404:268-281. doi: 10.1016/j.neuroscience.2019.01.026. Epub 2019 Jan 29. Neuroscience. 2019. PMID: 30703506
Cited by
-
Postnatal development of the electrophysiological properties of somatostatin interneurons in the anterior cingulate cortex of mice.Sci Rep. 2016 Jun 20;6:28137. doi: 10.1038/srep28137. Sci Rep. 2016. PMID: 27319800 Free PMC article.
-
Spontaneous Up states in vitro: a single-metric index of the functional maturation and regional differentiation of the cerebral cortex.Front Neural Circuits. 2015 Oct 13;9:59. doi: 10.3389/fncir.2015.00059. eCollection 2015. Front Neural Circuits. 2015. PMID: 26528142 Free PMC article.
-
A Role for KCNQ Channels on Cell Type-Specific Plasticity in Mouse Auditory Cortex after Peripheral Damage.J Neurosci. 2023 Mar 29;43(13):2277-2290. doi: 10.1523/JNEUROSCI.1070-22.2023. Epub 2023 Feb 22. J Neurosci. 2023. PMID: 36813573 Free PMC article.
-
Somatostatin-Expressing Inhibitory Interneurons in Cortical Circuits.Front Neural Circuits. 2016 Sep 29;10:76. doi: 10.3389/fncir.2016.00076. eCollection 2016. Front Neural Circuits. 2016. PMID: 27746722 Free PMC article. Review.
-
Spinal motoneuron firing properties mature from rostral to caudal during postnatal development of the mouse.J Physiol. 2020 Dec;598(23):5467-5485. doi: 10.1113/JP280274. Epub 2020 Sep 16. J Physiol. 2020. PMID: 32851667 Free PMC article.
References
-
- Ascoli G. A., Alonso-Nanclares L., Anderson S. A., Barrionuevo G., Benavides-Piccione R., Burkhalter A., Buzsaki G., Cauli B., Defelipe J., Fairen A., Feldmeyer D., Fishell G., Fregnac Y., Freund T. F., Gardner D., Gardner E. P., Goldberg J. H., Helmstaedter M., Hestrin S., Karube F., Kisvarday Z. F., Lambolez B., Lewis D. A., Marin O., Markram H., Munoz A., Packer A., Petersen C. C., Rockland K. S., Rossier J., Rudy B., Somogyi P., Staiger J. F., Tamas G., Thomson A. M., Toledo-Rodriguez M., Wang Y., West D. C., Yuste R. (2008). Petilla terminology: nomenclature of features of GABAergic interneurons of the cerebral cortex. Nat. Rev. Neurosci. 9, 557–568 10.1038/nrn2402 - DOI - PMC - PubMed
LinkOut - more resources
Full Text Sources
Research Materials

