. 2012 May 31:6:35.
doi: 10.3389/fncir.2012.00035. eCollection 2012.

Molecular analysis of ivy cells of the hippocampal CA1 stratum radiatum using spectral identification of immunofluorophores

Affiliations

Molecular analysis of ivy cells of the hippocampal CA1 stratum radiatum using spectral identification of immunofluorophores

Jozsef Somogyi et al. Front Neural Circuits. .

Abstract

Neuronal nitric oxide synthase-expressing (nNOS+) GABAergic interneurons are common in hippocampal stratum (str.) radiatum. However, these cells are less well characterized than nNOS+ ivy cells in str. pyramidale or neurogliaform cells (NGC) in str. lacunosum-moleculare. Here we have studied the laminar distribution of the axons and dendrites, and the immunoreactivity of these neurons recorded in rat hippocampal slices. We have used spectral analysis of antibody- or streptavidin-conjugated fluorophores to improve recognition of genuine signals in reactions for molecules such as nNOS and neuropeptide-Y (NPY). We found that most nNOS+ cells with soma in the CA1 area str. radiatum exhibit characteristic properties of ivy cells, and were positive for NPY and negative for reelin. However, laminar distributions of their neurites differ from original characterization of ivy cells with the soma in or close to str. pyramidale. Both their dendrites and axon are mainly in str. radiatum and to a lesser extent in str. oriens, and in addition often extend to str. lacunosum-moleculare. We conclude that ivy cells in str. radiatum may predominantly be feedforward inhibitory interneurons in the CA1 area, and their axonal output delivering GABA, NPY, and NO can influence both the entorhinal cortex innervated and the CA3 innervated zones pre- and post-synaptically. Spectral analysis of fluorophores provides an objective algorithm to analyze signals in immunoreactions for neurochemical markers.

Keywords: dendritic modulation; feedback inhibition; feedforward inhibition; slow GABA action; spectral imaging.


Figures
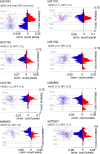
Figure 1
Figure 1
Laminar distribution of axons and dendrites of ivy cells with soma in the CA1 stratum radiatum. Eight reconstructed ivy cells with soma in str. radiatum. Individual images show digital, two-dimensional reconstructions of soma and dendrite (red) and axon (blue) from fluorescence image stacks of 2–4 merged sections, each 70 μm thick. Cell K261091 has most of its axonal arbor in str. oriens, whereas five cells have axon predominantly in str. radiatum and two (k060502, k070501) in strata radiatum and lacunosum-moleculare (s.l-m.). The axons and dendrites of most cells penetrate into s.l-m to a varying extent. The distributions of axons and dendrites in different laminae are illustrated as histograms on the right which show normalized pixel count detected for the axon and dendrites in the two-dimensional representations. Each bar shows proportion of pixels per bin (10 μm); the sum of all bins being 1. Ordinate: radial distance from the alveus towards the hippocampal fissure in mm. The cells were tested for nNOS and NPY immunoreactivity by epifluorescence and/or confocal spectral imaging. Semiquantitative fluorescence analysis values by confocal microscopy are shown above the cells as a ratio of cytoplasmic to neuropil pixel brightness. An arbitrary threshold of 1.5 was set as lower limit to consider a cell immunopositve. Cells showing ratios below 1.5 could either have a reduced immunoreactivity due to dialysis of the cytoplasm during whole-cell recording, or might not express the molecule. Laminae are indicated by abbreviations. not msd, not measured; nt, not tested because of damaged soma.
Figure 2
Figure 2
Evaluation of immunoreactions for cytoplasmic nNOS and NPY using semi-quantitative spectral analysis of fluorophore emission in one ivy cell (k111291). Fluorophore-specific spectral peak amplitudes were used to evaluate the specificity of emissions. (A) The red line illustrates emission spectrum from a region of interest (ROI 1) in the cytosol when three lasers are simultaneously activated in a cell reacted with streptavidin-Alexa Fluor 488, Cy3-conjugated secondary antibody testing for nNOS, and Cy5-conjugated secondary antibody testing for NPY. Blue line shows corresponding emission signal from a reference area (ROI 2) in the nucleus of a non-recorded cell nearby. Green line in plot A represents Alexa Fluor 488 emission reference spectrum recorded separately from another section which was labeled only with a secondary antibody-conjugated to Alexa Fluor 488. The sharp drop of signal strength at each laser wavelength (flagged as white indicates “on”) is caused by the triple band primary beam splitter. Ordinate values stand for emission intensity normalized to the maximum (255) in eight-bit images. Micrograph illustrates emission detected in one bin at the maximum wavelength (λ = 576 nm). Scale bar 10 μm. (B) The same cell when the 488 nm laser was switched off showing emission spectra measured in the two ROIs (line colors as in A). (C) Emission spectra from the cytoplasm (red) and reference area (blue) when only the 543 nm laser was activated (yellow line shows the reference emission spectrum of Cy3 fluorophore). Vertical black line at 576 nm points to amplitudes measured in the two ROIs at Cy3 emission peak wavelength. Green line shows emission from another somatic area with non-granular fluorescence pattern. In this area, the 543 nm laser elicits proportionally larger amplitude response in the Alexa-488 emission band, indicating the excitation of the Alexa488 fluorophore. In addition, a significant emission signal may emerge from autofluorescence over a wide range of wavelengths. Note that the amplitude ratios are higher here than in the cells reported in Table 2, because of the very low level of background in the reference area over the nucleus of an unlabeled cell, rather than from neuropil or from the nucleus of the recorded cell. (D) Emission spectrum when the 633 nm laser was activated alone. White line shows the reference emission spectrum from Cy5 measured separately. Vertical black line at 674 nm points to the amplitudes in the two ROIs at the peak emission wavelength of Cy5. Micrograph illustrates emission detected in one bin at the maximum wavelength (λ = 674 nm). The presence or absence of fluorophore-specific emission in the cell can be established, because the emission spectrum of each fluorophore has its characteristic peak at specific wavelength, as seen on both sides of the beam splitter (see green spectral line for Alexa Fluor 488 in A and yellow line for Cy3 in C). Because in spectrum B (red line) the emission amplitude is low at the wavelength of the peak of the emission from Alexa Fluor 488, while it is several times higher at the Cy3-specific emission peak, we can conclude that Cy3 emission provides the bulk of the signal. No significant cross-talk or shine-through from the Alexa Fluor 488 emission contributes to the signal measured from a ROI in the cytoplasm.

References

    1. Armstrong C., Szabadics J., Tamas G., Soltesz I. (2011). Neurogliaform cells in the molecular layer of the dentate gyrus as feed-forward gamma-aminobutyric acidergic modulators of entorhinal-hippocampal interplay. J. Comp. Neurol. 519, 1476–1491 10.1002/cne.22577 - DOI - PMC - PubMed
    1. Capogna M. (2011). Neurogliaform cells and other interneurons of stratum lacunosum-moleculare gate entorhinal-hippocampal dialogue. J. Physiol. 589, 1875–1883 10.1113/jphysiol.2010.201004 - DOI - PMC - PubMed
    1. Catania M. V., Tolle T. R., Monyer H. (1995). Differential expression of AMPA receptor subunits in NOS-positive neurons of cortex, striatum, and hippocampus. J. Neurosci. 15, 7046–7061 - PMC - PubMed
    1. de Bergeyck V., Naerhuyzen B., Goffinet A. M., Lambert de Rouvroit C. (1998). A panel of monoclonal antibodies against reelin, the extracellular matrix protein defective in reeler mutant mice. J. Neurosci. Methods 82, 17–24 10.1016/S0165-0270(98)00024-7 - DOI - PubMed
    1. Freund T. F., Buzsáki G. (1996). Interneurons of the hippocampus. Hippocampus 6, 347–470 10.1002/(SICI)1098-1063(1996)6:4<347::AID-HIPO1>3.0.CO;2-I - DOI - PubMed

LinkOut - more resources