

Genetic, morphometric, and behavioral factors linked to the midsagittal area of the corpus callosum
- PMID: 22666227
- PMCID: PMC3364465
- DOI: 10.3389/fgene.2012.00091
Genetic, morphometric, and behavioral factors linked to the midsagittal area of the corpus callosum
Abstract
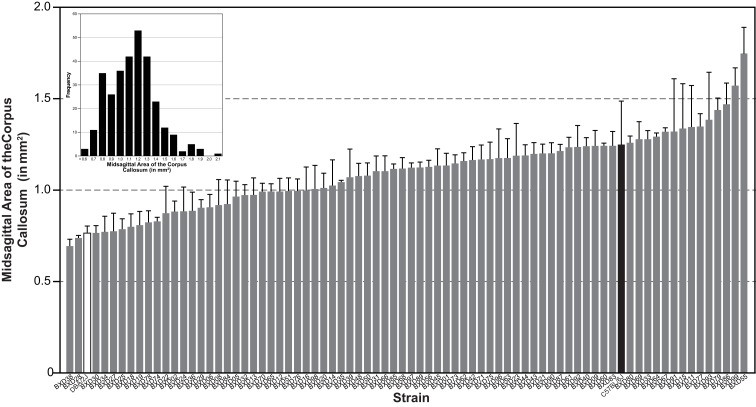
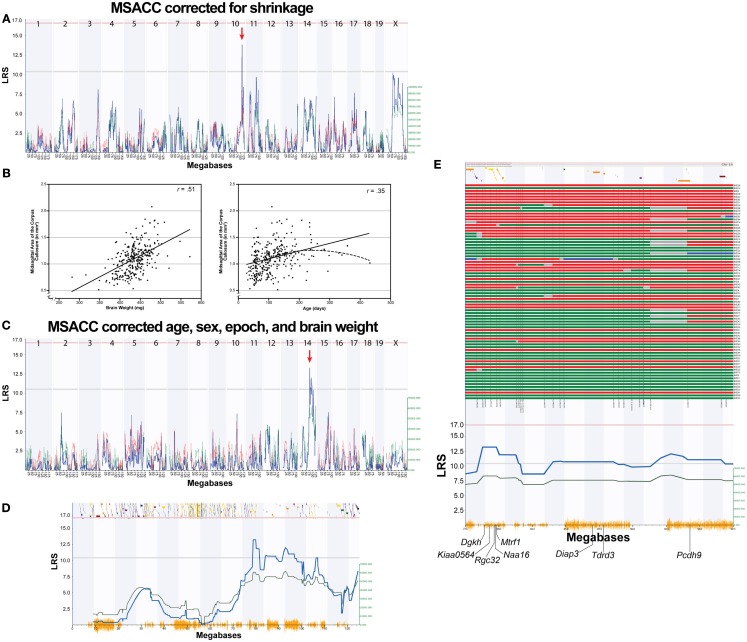
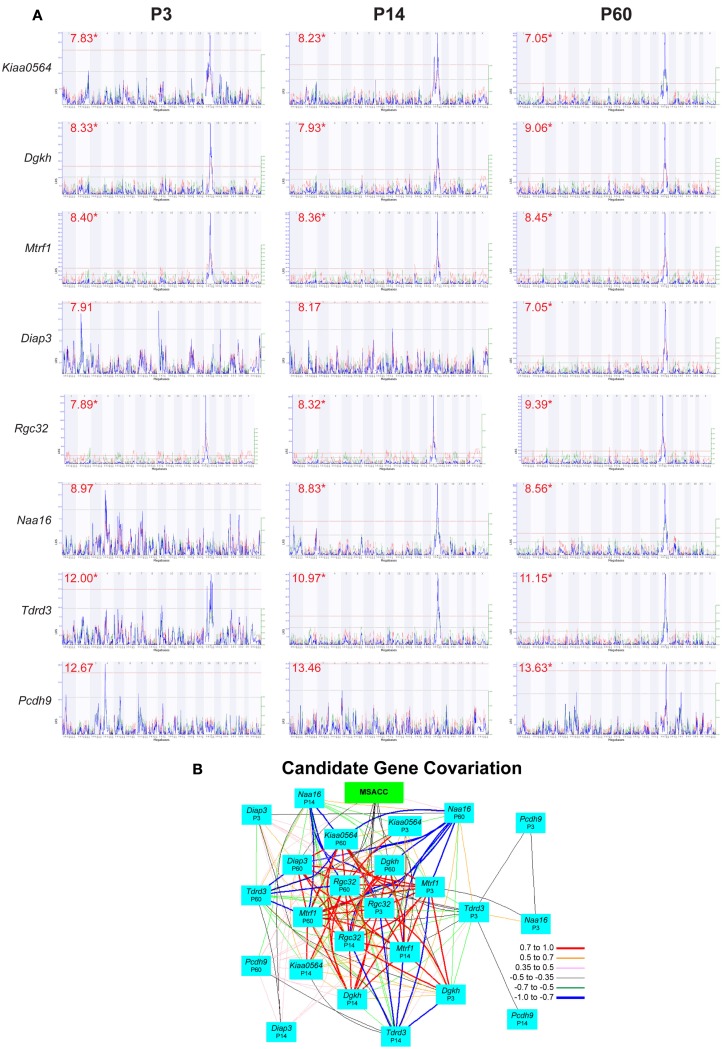
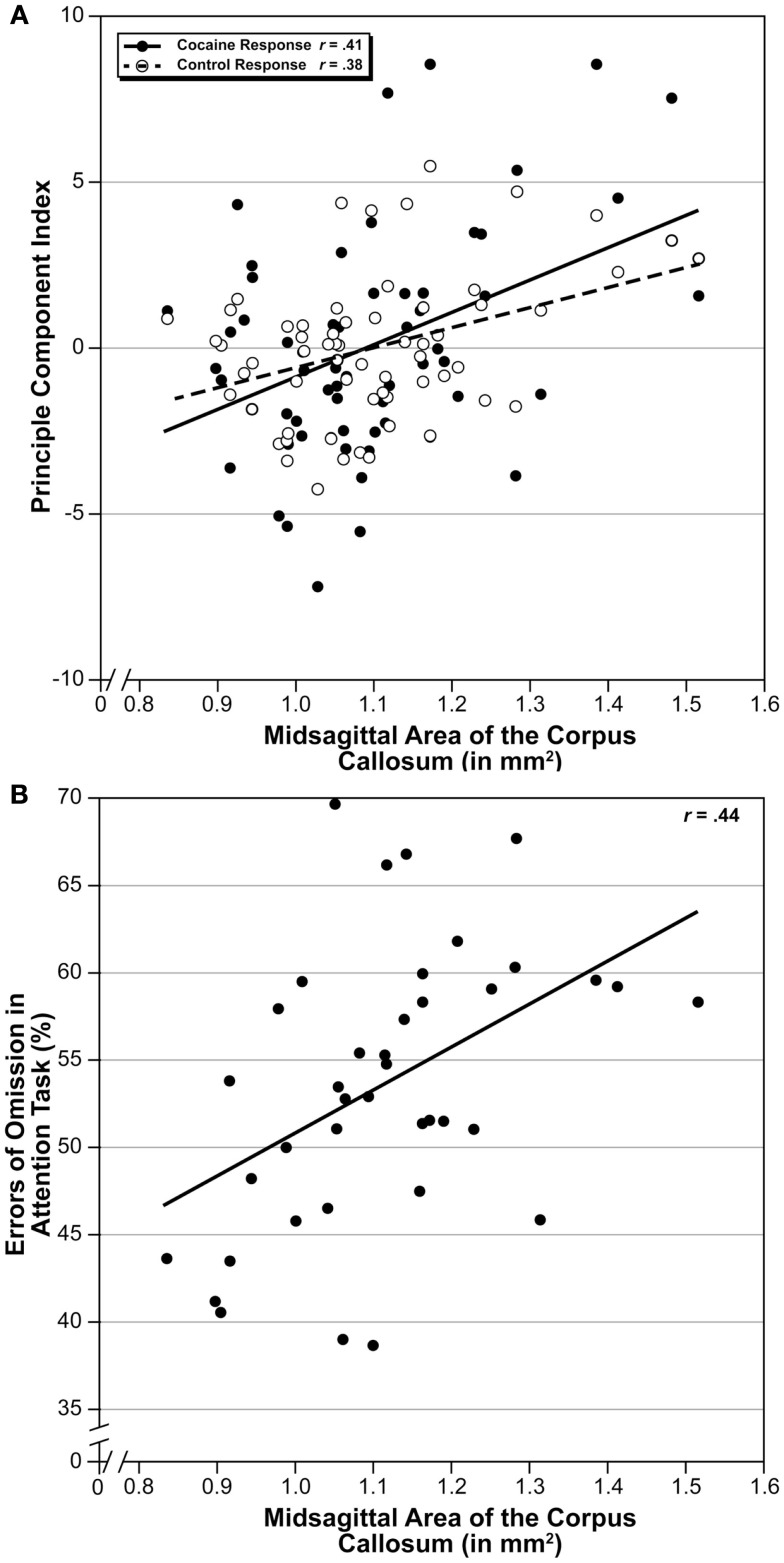
The corpus callosum is the main commissure connecting left and right cerebral hemispheres, and varies widely in size. Differences in the midsagittal area of the corpus callosum (MSACC) have been associated with a number of cognitive and behavioral phenotypes, including obsessive-compulsive disorders, psychopathy, suicidal tendencies, bipolar disorder, schizophrenia, autism, and attention deficit hyperactivity disorder. Although there is evidence to suggest that MSACC is heritable in normal human populations, there is surprisingly little evidence concerning the genetic modulation of this variation. Mice provide a potentially ideal tool to dissect the genetic modulation of MSACC. Here, we use a large genetic reference panel - the BXD recombinant inbred line - to dissect the natural variation of the MSACC. We estimated the MSACC in over 300 individuals from nearly 80 strains. We found a 4-fold difference in MSACC between individual mice, and a 2.5-fold difference among strains. MSACC is a highly heritable trait (h(2) = 0.60), and we mapped a suggestive QTL to the distal portion of Chr 14. Using sequence data and neocortical expression databases, we were able to identify eight positional and plausible biological candidate genes within this interval. Finally, we found that MSACC correlated with behavioral traits associated with anxiety and attention.
Keywords: BXD; QTL; corpus callosum; midsagittal area; mouse; neocortex.
Figures
Similar articles
-
The midsagittal area of the corpus callosum and total neocortical volume differ in three inbred strains of mice.Exp Neurol. 1990 Mar;107(3):271-6. doi: 10.1016/0014-4886(90)90145-i. Exp Neurol. 1990. PMID: 2307205
-
The genetic control of neocortex volume and covariation with neocortical gene expression in mice.BMC Neurosci. 2009 May 9;10:44. doi: 10.1186/1471-2202-10-44. BMC Neurosci. 2009. PMID: 19426526 Free PMC article.
-
Identifying human disease genes through cross-species gene mapping of evolutionary conserved processes.PLoS One. 2011 May 4;6(5):e18612. doi: 10.1371/journal.pone.0018612. PLoS One. 2011. PMID: 21572526 Free PMC article.
-
[Behavioral and cognitive profile of corpus callosum agenesia - Review].Ideggyogy Sz. 2016 Nov 30;69(11-12):373-379. doi: 10.18071/isz.69.0373. Ideggyogy Sz. 2016. PMID: 29733554 Review. Hungarian.
-
Agenesis of the corpus callosum: lessons from humans and mice.Clin Invest Med. 2005 Oct;28(5):267-82. Clin Invest Med. 2005. PMID: 16265999 Review.
Cited by
-
Ge-SAND: an explainable deep learning-driven framework for disease risk prediction by uncovering complex genetic interactions in parallel.BMC Genomics. 2025 May 1;26(1):432. doi: 10.1186/s12864-025-11588-9. BMC Genomics. 2025. PMID: 40312319 Free PMC article.
-
The effects of Kiaa0319 knockdown on cortical and subcortical anatomy in male rats.Int J Dev Neurosci. 2013 Apr;31(2):116-22. doi: 10.1016/j.ijdevneu.2012.11.008. Epub 2012 Dec 5. Int J Dev Neurosci. 2013. PMID: 23220223 Free PMC article.
-
Genetic Modulation of Initial Sensitivity to Δ9-Tetrahydrocannabinol (THC) Among the BXD Family of Mice.Front Genet. 2021 Jul 23;12:659012. doi: 10.3389/fgene.2021.659012. eCollection 2021. Front Genet. 2021. PMID: 34367237 Free PMC article.
-
Beneficial effect of phosphatidylcholine supplementation in alleviation of hypomania and insomnia in a Chinese bipolar hypomanic boy and a possible explanation to the effect at the genetic level.Springerplus. 2015 May 20;4:235. doi: 10.1186/s40064-015-1002-y. eCollection 2015. Springerplus. 2015. PMID: 26120503 Free PMC article.
-
Developmental exposure to concentrated ambient ultrafine particulate matter air pollution in mice results in persistent and sex-dependent behavioral neurotoxicity and glial activation.Toxicol Sci. 2014 Jul;140(1):160-78. doi: 10.1093/toxsci/kfu059. Epub 2014 Apr 1. Toxicol Sci. 2014. PMID: 24690596 Free PMC article.
References
-
- Anney R., Klei L., Pinto D., Regan R., Conroy J., Magalhaes T. R., Correia C., Abrahams B. S., Sykes N., Pagnamenta A. T., Almeida J., Bacchelli E., Bailey A. J., Baird G., Battaglia A., Berney T., Bolshakova N., Bolte S., Bolton P. F., Bourgeron T., Brennan S., Brian J., Carson A. R., Casallo G., Casey J., Chu S. H., Cochrane L., Corsello C., Crawford E. L., Crossett A., Dawson G., De Jonge M., Delorme R., Drmic I., Duketis E., Duque F., Estes A., Farrar P., Fernandez B. A., Folstein S. E., Fombonne E., Freitag C. M., Gilbert J., Gillberg C., Glessner J. T., Goldberg J., Green J., Guter S. J., Hakonarson H., Heron E. A., Hill M., Holt R., Howe J. L., Hughes G., Hus V., Igliozzi R., Kim C., Klauck S. M., Kolevzon A., Korvatska O., Kustanovich V., Lajonchere C. M., Lamb J. A., Laskawiec M., Leboyer M., Le Couteur A., Leventhal B. L., Lionel A. C., Liu X. Q., Lord C., Lotspeich L., Lund S. C., Maestrini E., Mahoney W., Mantoulan C., Marshall C. R., Mcconachie H., Mcdougle C. J., Mcgrath J., Mcmahon W. M., Melhem N. M., Merikangas A., Migita O., Minshew N. J., Mirza G. K., Munson J., Nelson S. F., Noakes C., Noor A., Nygren G., Oliveira G., Papanikolaou K., Parr J. R., Parrini B., Paton T., Pickles A., Piven J., Posey D. J., Poustka A., Poustka F., Prasad A., Ragoussis J., Renshaw K., Rickaby J., Roberts W., Roeder K., Roge B., Rutter M. L., Bierut L. J., Rice J. P., Salt J., Sansom K., Sato D., Segurado R., Senman L., Shah N., Sheffield V. C., Soorya L., Sousa I., Stoppioni V., Strawbridge C., Tancredi R., Tansey K., Thiruvahindrapduram B., Thompson A. P., Thomson S., Tryfon A., Tsiantis J., Van Engeland H., Vincent J. B., Volkmar F., Wallace S., Wang K., Wang Z., Wassink T. H., Wing K., Wittemeyer K., Wood S., Yaspan B. L., Zurawiecki D., Zwaigenbaum L., Betancur C., Buxbaum J. D., Cantor R. M., Cook E. H., Coon H., Cuccaro M. L., Gallagher L., Geschwind D. H., Gill M., Haines J. L., Miller J., Monaco A. P., Nurnberger J. I., Jr., Paterson A. D., Pericak-Vance M. A., Schellenberg G. D., Scherer S. W., Sutcliffe J. S., Szatmari P., Vicente A. M., Vieland V. J., Wijsman E. M., Devlin B., Ennis S., Hallmayer J. (2010). A genome-wide scan for common alleles affecting risk for autism. Hum. Mol. Genet. 19, 4072–408210.1093/hmg/ddq307 - DOI - PMC - PubMed
Grants and funding
LinkOut - more resources
Full Text Sources
Molecular Biology Databases