. 2012:2012:643929.
doi: 10.1155/2012/643929. Epub 2012 May 16.

Early decrease in respiration and uncoupling event independent of cytochrome C release in PC12 cells undergoing apoptosis

Affiliations

Early decrease in respiration and uncoupling event independent of cytochrome C release in PC12 cells undergoing apoptosis

Libera Berghella et al. Int J Cell Biol. 2012.

Abstract

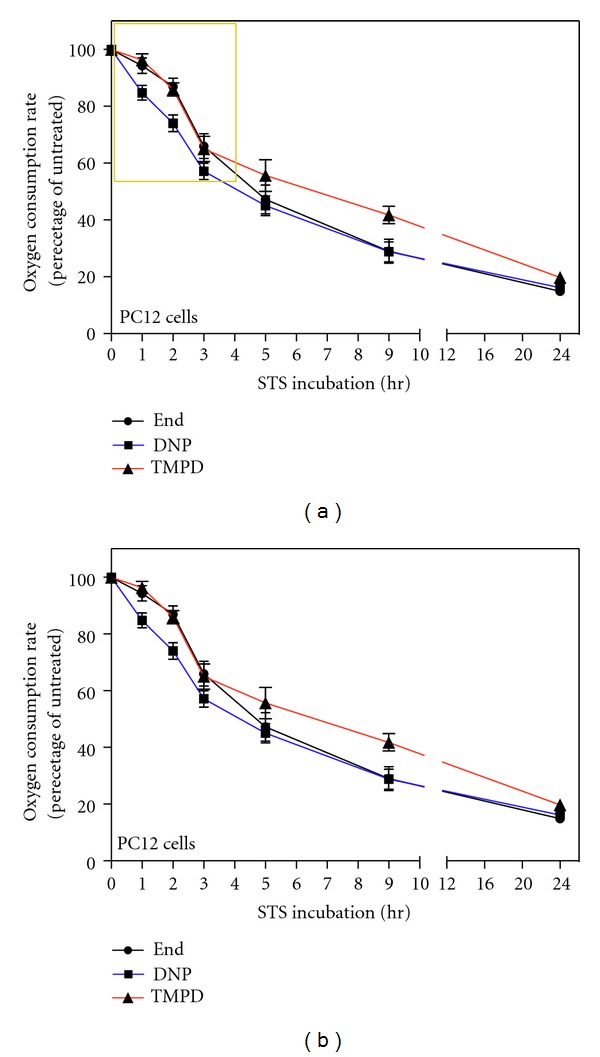
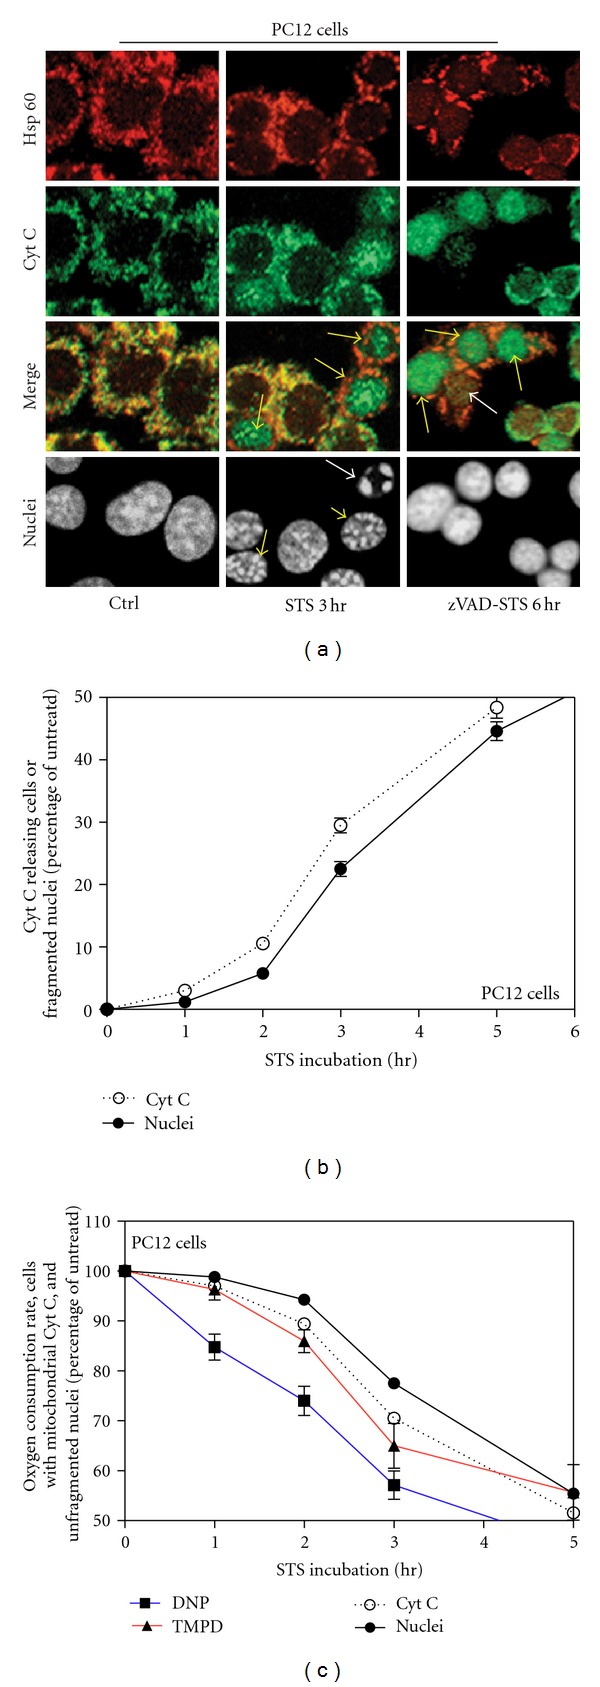
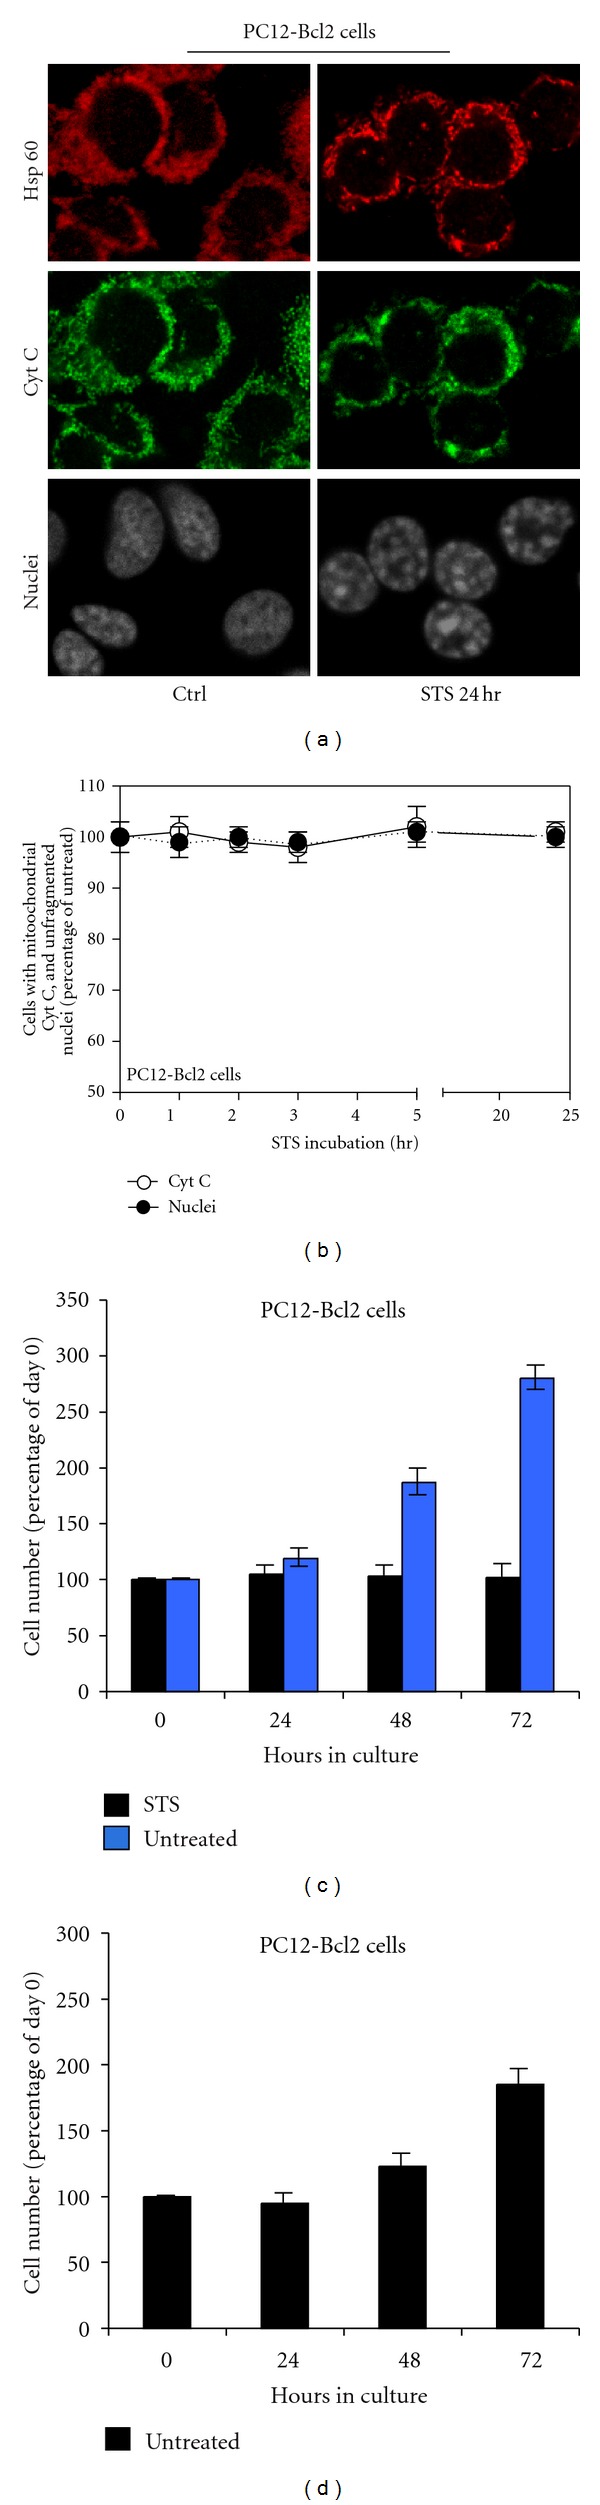
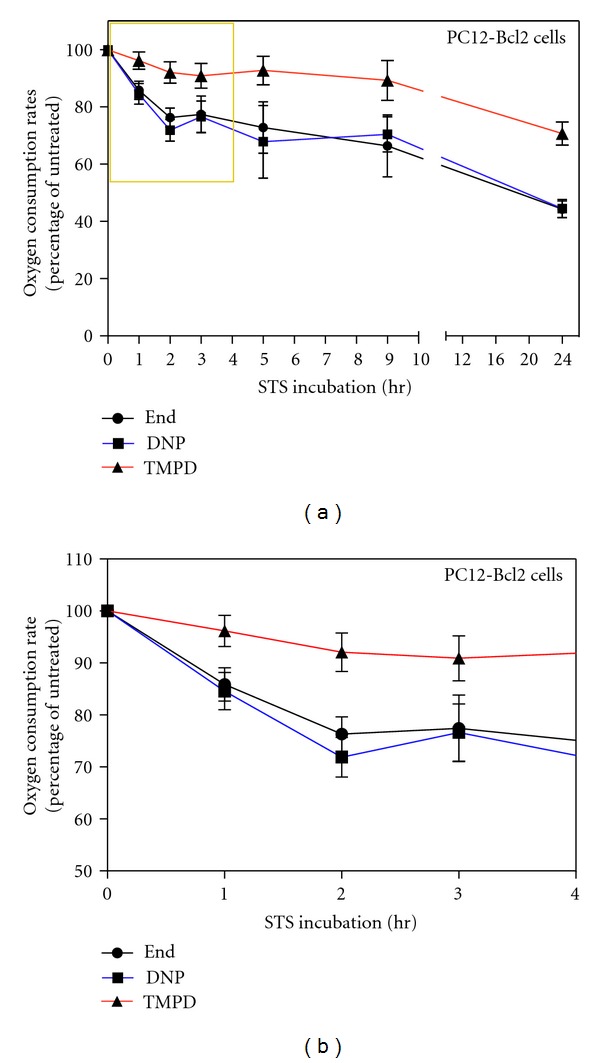
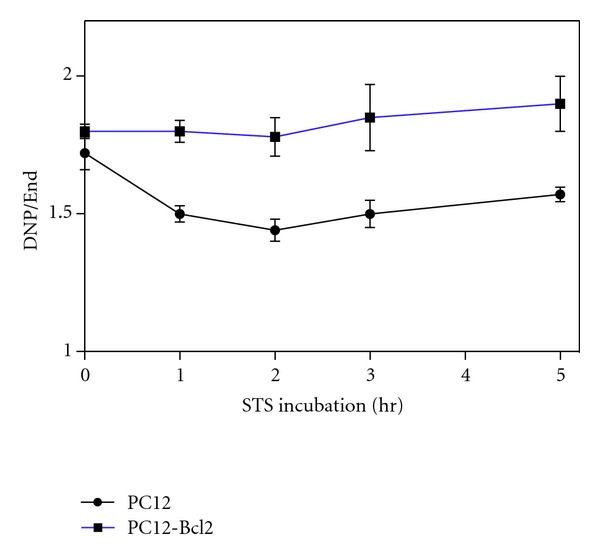
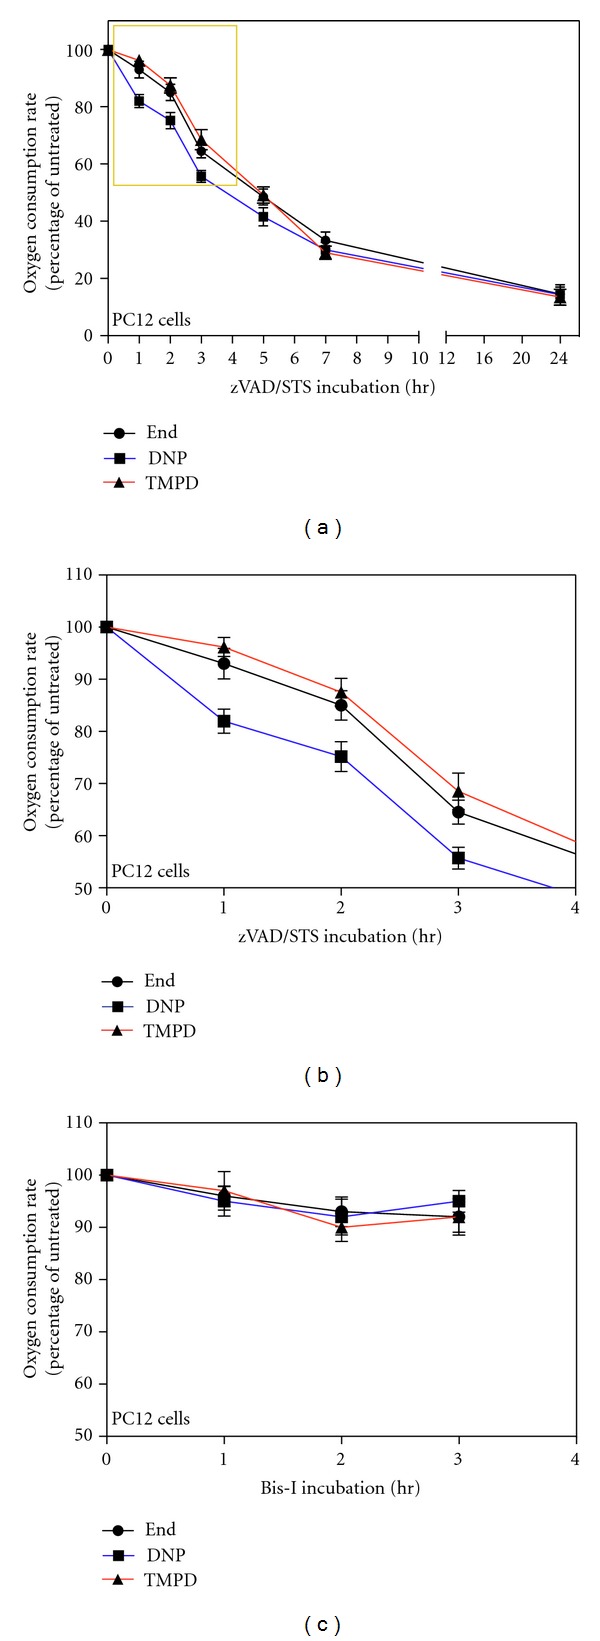
Cytochrome c is a key molecule in mitochondria-mediated apoptosis. It also plays a pivotal role in cell respiration. The switch between these two functions occurs at the moment of its release from mitochondria. This process is therefore extremely relevant for the fate of the cell. Since cytochrome c mediates respiration, we studied the changes in respiratory chain activity during the early stages of apoptosis in order to contribute to unravel the mechanisms of cytochrome c release. We found that, during staurosporine (STS)- induced apoptosis in PC12 cells, respiration is affected before the release of cytochrome c, as shown by a decrease in the endogenous uncoupled respiration and an uncoupling event, both occurring independently of cytochrome c release. The decline in the uncoupled respiration occurs also upon Bcl-2 overexpression (which inhibits cytochrome c release), while the uncoupling event is inhibited by Bcl-2. We also observed that the first stage of nuclear condensation during STS-induced apoptosis does not depend on the release of cytochrome c into the cytosol and is a reversibile event. These findings may contribute to understand the mechanisms affecting mitochondria during the early stages of apoptosis and priming them for the release of apoptogenic factors.


Figures

Figure 1
Figure 1
Decrease in endogenous, DNP-uncoupled, and TMPD-dependent respiration rates in intact PC12 cells treated with STS; early decrease in DNP-uncoupled respiration. (a) Oxygen consumption rates of 2 μM STS-treated PC12 cells measured at the indicated time points. Oxygen consumption rates were measured in TD buffer (endogenous respiration, End), in TD buffer containing DNP (DNP-uncoupled respiration, DNP) and in TD buffer containing DNP, antimycin A, ascorbate, and TMPD (TMPD-dependent respiration, TMPD). Data are expressed, at each time point, as percentages of the oxygen consumption of untreated cells (0 hr). To reduce the variability of the experiments we calculated the percentages with respect to the control of that particular experiment, and then we averaged the percentages. Data are expressed as means ± SE (standard error) with n varying at each time point and being 31, 16, 9, 6, 7, 2, and 7, respectively, for the indicated time points (1 h, 2 h, 3 h, 5 h, 9 h, 24 h). (b) Magnification of (a) area surrounded by a yellow frame. Note that the ordinate scale starts at 50%.
Figure 2
Figure 2
Cytochrome c release and nuclear apoptosis in STS-treated PC12 cells. (a) Triple labeling confocal immunofluorescence microscopy of cells untreated (Ctrl), 2 μM STS-treated for 3 h (STS 3 h), or 2 μM STS-treated for 6 h with 30 min zVADfmk (100 uM) pretreatment (zVAD-STS 6 h). Pattern of Hsp60 (red), cytochrome c (green), merged patterns (yellow) and nuclear staining by SYTO-X (grey) of the same representative fields are shown. (b) Percentage of cytochrome c releasing and apoptotic PC12 cells treated with STS for the indicated time. Data calculated in 3 independent experiments for each time point. About 1000 cells were considered for each experiment at each time point. Some SE are small and are within the symbols. Note that the ordinate scale starts at 50%. (c) Comparison between data shown in Figure 2(b) but expressed as decrease of cells with mitochondrially localized cytochrome c and decrease of alive cells and data regarding decrease in respiration shown in Figure 1(b).
Figure 3
Figure 3
Cytochrome c localization and nuclear changes in STS-treated PC12-Bcl-2 cells. (a) Triple labeling confocal immunofluorescence microscopy of PC12-Bcl-2 cells untreated (Ctrl) and 2 μM STS-treated for 24 h (STS 24 h). Pattern of Hsp60 (red), cytochrome c (green), and nuclear staining by SYTO-X (grey) of the same representative fields are shown. (b) Percentage of PC12-Bcl2 cells with mitochondrially localized cytochrome c and percentage of alive PC12-Bcl2 cells treated with STS for the indicated time. Data were calculated in 3 independent experiments for each time point. About 1000 cells were considered for each experiment at each time point. Note that the ordinate scale starts at 50%. (c) For quantification of cell proliferation, the same number of untreated or STS-treated PC12-Bcl2 cells was plated on several dishes and counted at the indicated times. Data were calculated in 3 independent experiments for each time point. (d) For quantification of cell proliferation, the same number of STS-treated PC12-Bcl2 cells were plated on several dishes and counted at the indicated times. At 24 h the medium was replaced in order to remove STS. Data were calculated in 3 independent experiments for each time point.
Figure 4
Figure 4
Decrease in endogenous, DNP-uncoupled, and TMPD-dependent respiration rates in intact PC12-Bcl-2 cells treated with STS; early decrease in DNP-uncoupled respiration. (a) Oxygen consumption rates of STS-treated PC12-Bcl-2 cells measured at the indicated time points. Oxygen consumption rates were measured in TD buffer (endogenous respiration, End), in TD buffer containing DNP (DNP-uncoupled respiration, DNP) and in TD buffer containing DNP, antimycin A, ascorbate and TMPD (TMPD-dependent respiration, TMPD). Data are expressed, at each time point, as percentages of the oxygen consumption of untreated cells (0 hr). The data represent the means ± SE with n varying at each time point and being 17, 20, 12, 2, 3, 6, 8 respectively for the indicated time points (1 h, 2 h, 3 h, 5 h, 9 h, 24 h). (b) magnification of (a) area surrounded by a yellow frame. Note that the ordinate scale starts at 50%.
Figure 5
Figure 5
Uncoupling ratio behaviour in STS treated PC12 and PC12-Bcl-2 cells. Ratio between absolute DNP-uncoupled oxygen consumption and endogenous respiration expressed in nanomoles of oxygen consumed per minute and per mg of cellular proteins (nmolO2/min/mg) of PC12 and PC12-Bcl-2 cells under 2 μM STS-treatment for the indicated time. In detail, for the indicated time points (0 h, 1 h, 2 h, 3 h, 5 h), endogenous respiration oxygen consumption values are 14,82; 13,99; 12,75; 10,12; 11,10 nmolO2/min/mg for PC12 cells and 15,82; 12,78; 10,94; 10,98; 9,81 nmolO2/min/mg for PC12-Bcl-2 cells. DNP-uncoupled oxygen consumption values are 25,50; 20,99; 18,36; 15,17; 17,43 nmolO2/min/mg and 28,48; 23,14; 19,48; 20,31; 18,64 nmolO2/min/mg.
Figure 6
Figure 6
Decrease in endogenous, DNP-uncoupled, and TMPD-dependent respiration rates in STS-treated PC12 cells pretreated with z-VADfmk and in Bis-I-treated cells. (a) Relative oxygen consumption rates of 100 μM zVADfmk-pretreated, 2 μM STS-treated PC12 cells for the indicated times. Oxygen consumption rates were measured in TD buffer (endogenous respiration, End), in TD buffer containing DNP (DNP-uncoupled respiration, DNP) and in TD buffer containing DNP, antimycin A, ascorbate and TMPD (TMPD-dependent respiration, TMPD). Data are expressed, at each time point, as percentages of the oxygen consumption of untreated cells (0 hr). Data are expressed as means ± SE with n varying at each time point and being 8, 6, 6, 2, 3, 2, 3 for 1 h, 2 h, 3 h, 5 h, 9 h, and 24 h, respectively. (b) Magnification of the panel (a) area surrounded by a yellow frame. Note that the ordinate scale starts at 50%. (c) Relative oxygen consumption rates of Bis-I-treated PC12 cells for the indicated times. Data are expressed as means ± SE with n varying at each time point and being 5, 6, and 5 for 1 h, 2 h, and 3 h respectively.

References

    1. Liu X, Kim CN, Yang J, Jemmerson R, Wang X. Induction of apoptotic program in cell-free extracts: requirement for dATP and cytochrome c . Cell. 1996;86(1):147–157. - PubMed
    1. Li P, Nijhawan D, Budihardjo I, et al. Cytochrome c and dATP-dependent formation of Apaf-1/caspase-9 complex initiates an apoptotic protease cascade. Cell. 1997;91(4):479–489. - PubMed
    1. Srinivasula SM, Ahmad M, Fernandes-Alnemri T, Alnemri ES. Autoactivation of procaspase-9 by Apaf-1-mediated oligomerization. Molecular Cell. 1998;1(7):949–957. - PubMed
    1. Cory S, Adams JM. The BCL2 family: regulators of the cellular life-or-death switch. Nature Reviews Cancer. 2002;2(9):647–656. - PubMed
    1. Llambi F, Moldoveanu T, Tait SWG, et al. A unified model of mammalian BCL-2 protein family interactions at the mitochondria. Molecular Cell. 2011;44(4):517–531. - PMC - PubMed

LinkOut - more resources