

doi: 10.1021/nl301480h.
Epub 2012 Jun 8.
Live-cell imaging of single receptor composition using zero-mode waveguide nanostructures
Affiliations
- PMID: 22668081
- PMCID: PMC3397148
- DOI: 10.1021/nl301480h
Item in Clipboard
Live-cell imaging of single receptor composition using zero-mode waveguide nanostructures
Nano Lett.
.
Abstract
We exploit the optical and spatial features of subwavelength nanostructures to examine individual receptors on the plasma membrane of living cells. Receptors were sequestered in portions of the membrane projected into zero-mode waveguides. Using single-step photobleaching of green fluorescent protein incorporated into individual subunits, the resulting spatial isolation was used to measure subunit stoichiometry in α4β4 and α4β2 nicotinic acetylcholine and P2X2 ATP receptors. We also show that nicotine and cytisine have differential effects on α4β2 stoichiometry.
Figures
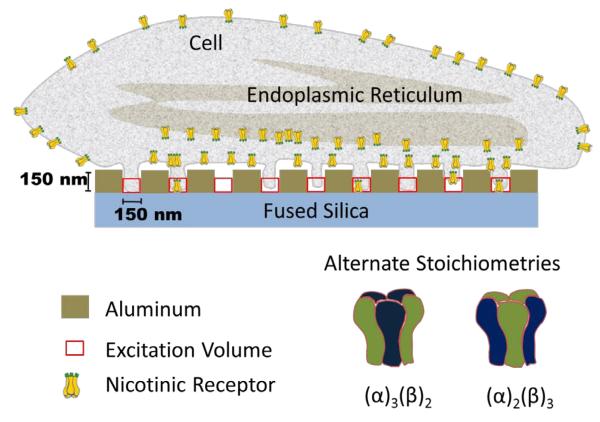
Schematic of a cell plated directly on the array with extensions of small portions of the membrane protruding into ZMWs. The schematic exaggerates the well size relative to spacing, in order to illustrate the entry of the cell membrane into the wells. An individual cell typically covers 75-100 wells. The excitation volume extends ~ 50 nm into the wells creating a ~ 250 zl excitation volume for a 120 nm ZMW, as depicted by the red squares (see supplemental material). Only a few nAChRs in the plasma membrane enter wells, probably in filopodia. Under many circumstances, the ER and other organelles contain a majority of the cell’s nAChR; but these do not enter wells. The diagram of the receptors illustrates that nicotinic receptors can potentially assemble into two stoichiometries: α3β2 or α2β3.
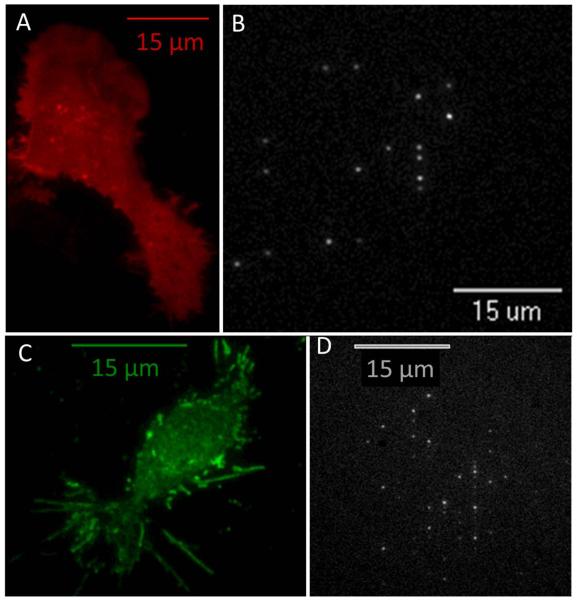
A. N2a cells plated on a glass coverslip transfected with a plasma membrane localized monomeric cherry marker (PM-mcherry) imaged with TIRF microscopy illustrating the extent of membrane expression in both the soma and the processes. B. N2a cells cultured directly on the ZMW array and transfected with the same membrane marker as in (a), and imaged from the glass side of the array. Fluorescent spots indicate the portions of the membrane containing the PM-mcherry marker that have entered the ZMW and lie within the excitation volume. C. N2a cells plated on a glass coverslip transfected with α4-GFP β4-wt and imaged with TIRF microscopy. The image shows that α4β4 nAChRs are primarily localized on the plasma membrane and also shows the presence of many filopodia (5 – 15 μm in length) containing fluorescent nAChRs. D. N2a cells cultured directly on the array and transfected in the same manner as in (c). Fluorescent spots indicate that portions of the membrane, probably filopodia, containing fluorescently labeled α4β4 nAChRs extend into the ZMWs. The size of the pattern made by the fluorescent wells is consistent with the size of a typical cell.
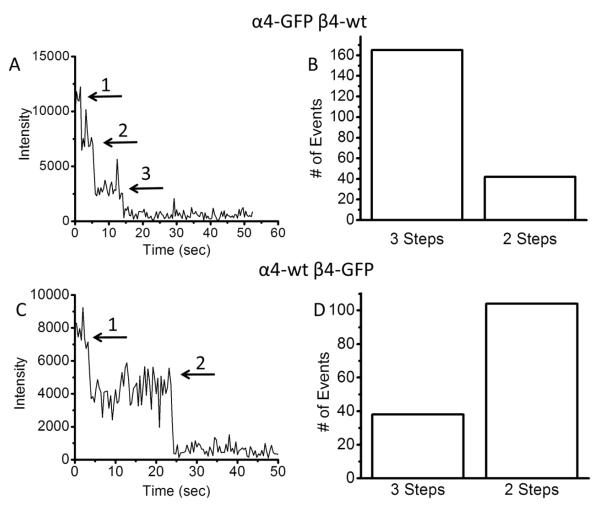
A. Time course of fluorescence intensity from a ZMW in a dish containing N2a cells transfected with α4-GFP + β4-wt. The trace shows three bleaching steps as indicated by the arrows. The different fluorescence levels are separated by clear steps until all the GFP molecules bleach to the background level. B. Number of three-step and two-step bleaching events observed for α4-GFP + β4-wt showing predominantly three bleaching steps. This indicates primarily (α4)3(β4)2 stoichiometry. C. Time course of fluorescence intensity from a well in a dish transfected with α4-wt + β4-GFP. The time trace shows two bleaching steps as indicated by the arrows. D. Number of three-step and two-step bleaching events observed for α4-wt + β4-GFP showing predominantly two bleaching steps. This also indicates primarily (α4)3(β4)2 stoichiometry.
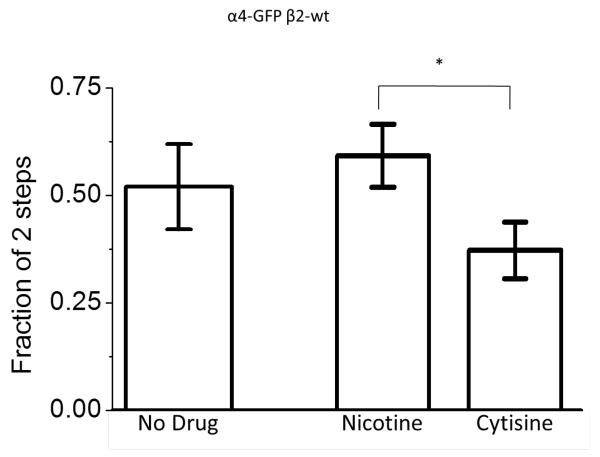
Fraction of the informative wells exhibiting 2 bleaching steps for α4-GFP + β2-wt exposed to no drug (n= 81), nicotine (n=179), and cytisine (n=117). The error bars show the relative standard error of the mean of the wells exhibiting 2-step bleaching. *, significant at P < 0.05.
Similar articles
-
Roles of nicotinic acetylcholine receptor beta subunits in function of human alpha4-containing nicotinic receptors.J Physiol. 2006 Oct 1;576(Pt 1):103-18. doi: 10.1113/jphysiol.2006.114645. Epub 2006 Jul 6. J Physiol. 2006. PMID: 16825297 Free PMC article.
-
Structural characterization of binding mode of smoking cessation drugs to nicotinic acetylcholine receptors through study of ligand complexes with acetylcholine-binding protein.J Biol Chem. 2012 Jul 6;287(28):23283-93. doi: 10.1074/jbc.M112.360347. Epub 2012 May 2. J Biol Chem. 2012. PMID: 22553201 Free PMC article.
-
[Crystal and molecular structure of cytisine salts].Przegl Lek. 2012;69(10):998-1003. Przegl Lek. 2012. PMID: 23421078 Polish.
-
(-)-Cytisine and derivatives: synthesis, reactivity, and applications.Chem Rev. 2014 Jan 8;114(1):712-78. doi: 10.1021/cr400307e. Epub 2013 Oct 11. Chem Rev. 2014. PMID: 24117010 Review. No abstract available.
-
Cytisine: a natural product lead for the development of drugs acting at nicotinic acetylcholine receptors.Nat Prod Rep. 2012 May 1;29(5):555-67. doi: 10.1039/c2np00100d. Epub 2012 Feb 27. Nat Prod Rep. 2012. PMID: 22367109 Review.
Cited by
-
Photoluminescence Enhancement, Blinking Suppression, and Improved Biexciton Quantum Yield of Single Quantum Dots in Zero Mode Waveguides.J Phys Chem Lett. 2021 Apr 8;12(13):3303-3311. doi: 10.1021/acs.jpclett.1c00450. Epub 2021 Mar 25. J Phys Chem Lett. 2021. PMID: 33765768 Free PMC article.
-
Förster resonance energy transfer (FRET) correlates of altered subunit stoichiometry in cys-loop receptors, exemplified by nicotinic α4β2.Int J Mol Sci. 2012;13(8):10022-10040. doi: 10.3390/ijms130810022. Epub 2012 Aug 10. Int J Mol Sci. 2012. PMID: 22949846 Free PMC article.
-
Mammalian Cell-derived Vesicles for the Isolation of Organelle Specific Transmembrane Proteins to Conduct Single Molecule Studies.Bio Protoc. 2018 May 5;8(9):e2825. doi: 10.21769/BioProtoc.2825. Bio Protoc. 2018. PMID: 30406159 Free PMC article.
-
Mixed metal zero-mode guides (ZMWs) for tunable fluorescence enhancement.Nanoscale Adv. 2020 Mar 25;2(5):1894-1903. doi: 10.1039/c9na00641a. eCollection 2020 May 19. Nanoscale Adv. 2020. PMID: 36132495 Free PMC article.
-
Current approaches to studying membrane organization.F1000Res. 2015 Nov 30;4:F1000 Faculty Rev-1380. doi: 10.12688/f1000research.6868.1. eCollection 2015. F1000Res. 2015. PMID: 26918150 Free PMC article. Review.
References
Publication types
MeSH terms
Substances
Grants and funding
LinkOut - more resources
Full Text Sources
