Review
. 2012 Jun;23(6):396-411; quiz 495.
doi: 10.3766/jaaa.23.6.3.

Plasticity in the developing auditory cortex: evidence from children with sensorineural hearing loss and auditory neuropathy spectrum disorder

Affiliations
Review

Plasticity in the developing auditory cortex: evidence from children with sensorineural hearing loss and auditory neuropathy spectrum disorder

Garrett Cardon et al. J Am Acad Audiol. 2012 Jun.

Abstract

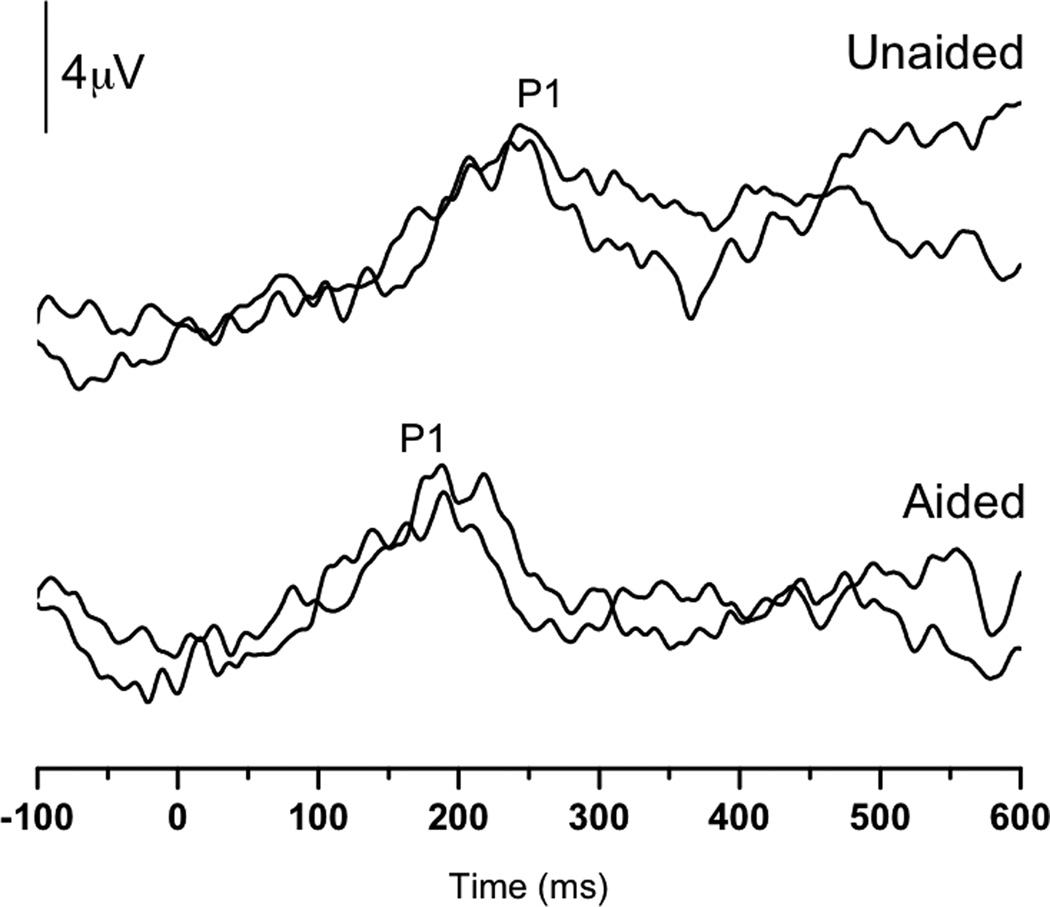
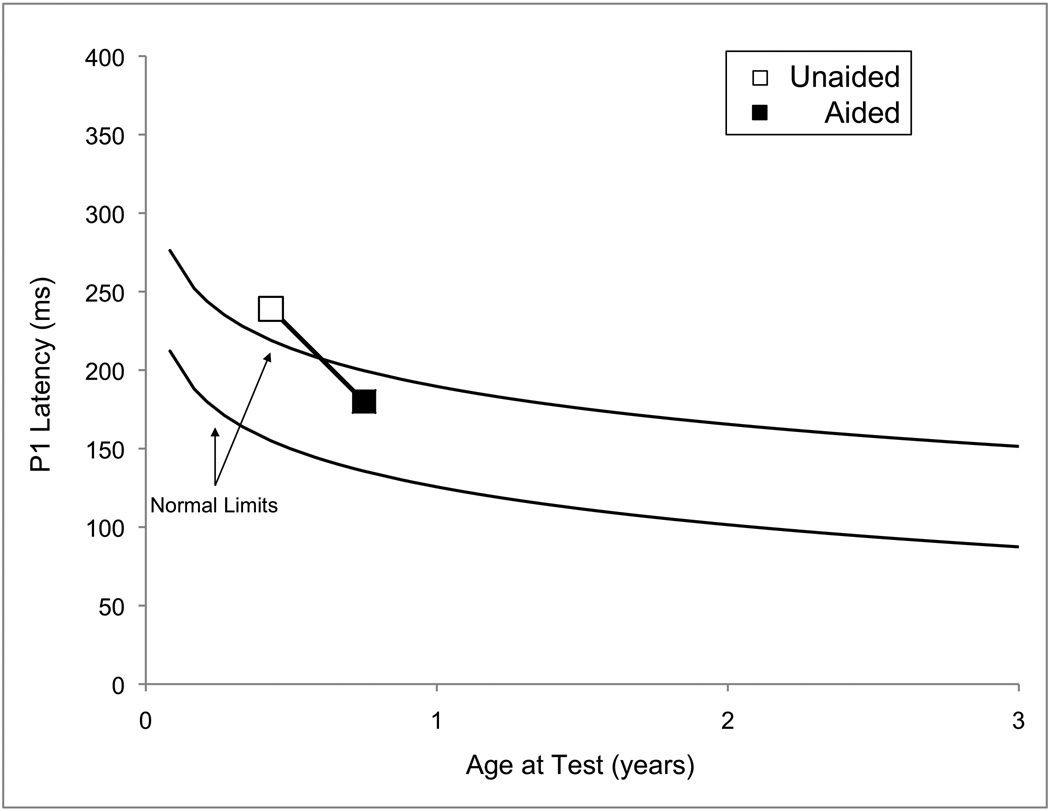
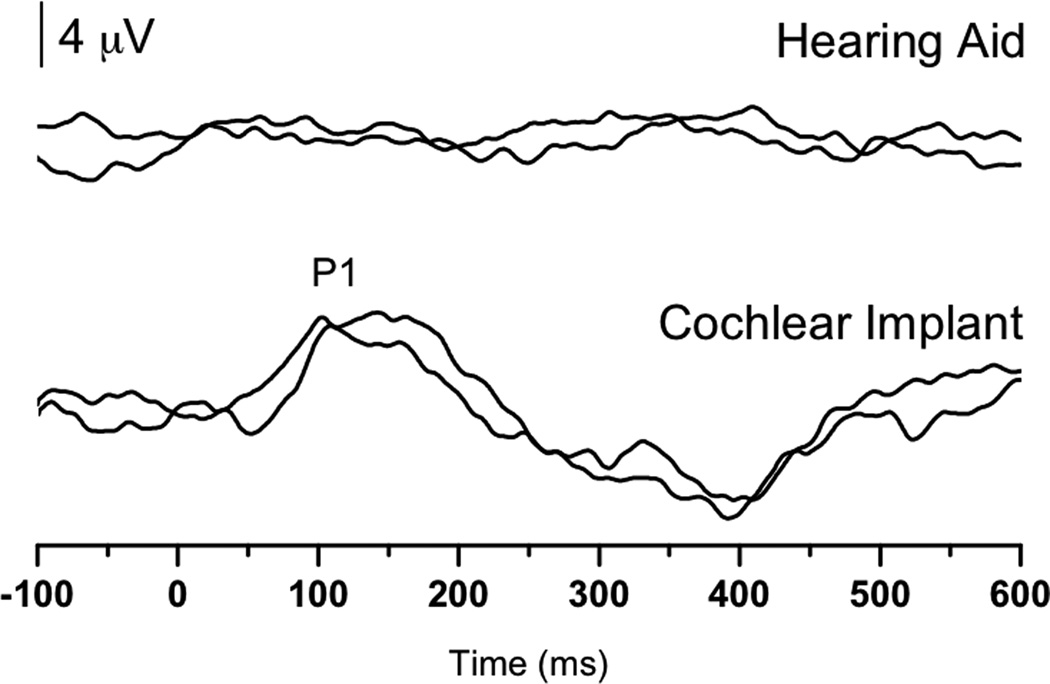
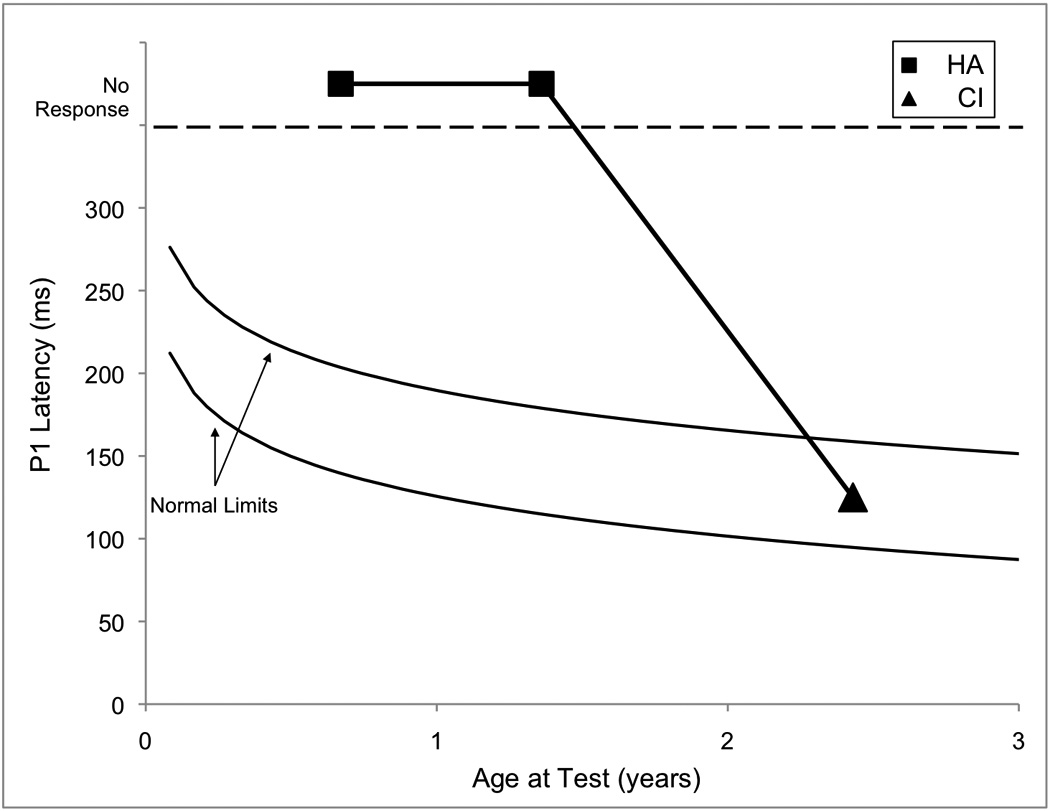
The developing auditory cortex is highly plastic. As such, the cortex is both primed to mature normally and at risk for reorganizing abnormally, depending upon numerous factors that determine central maturation. From a clinical perspective, at least two major components of development can be manipulated: (1) input to the cortex and (2) the timing of cortical input. Children with sensorineural hearing loss (SNHL) and auditory neuropathy spectrum disorder (ANSD) have provided a model of early deprivation of sensory input to the cortex and demonstrated the resulting plasticity and development that can occur upon introduction of stimulation. In this article, we review several fundamental principles of cortical development and plasticity and discuss the clinical applications in children with SNHL and ANSD who receive intervention with hearing aids and/or cochlear implants.


Figures

Figure 1
Figure 1
(Panel A): P1 CAEP waveforms (with replications) for both unaided (top) and aided (bottom) P1 testing sessions performed with Case 1 (SC). (Panel B): Unaided (open square) and aided (filled square) P1 latencies plotted by age at test and compared to the 95% confidence intervals for normal P1 latency development (Sharma et al., 2002c). The unaided P1 latency was delayed, while the latency of the aided results was within normal limits.
Figure 1
Figure 1
(Panel A): P1 CAEP waveforms (with replications) for both unaided (top) and aided (bottom) P1 testing sessions performed with Case 1 (SC). (Panel B): Unaided (open square) and aided (filled square) P1 latencies plotted by age at test and compared to the 95% confidence intervals for normal P1 latency development (Sharma et al., 2002c). The unaided P1 latency was delayed, while the latency of the aided results was within normal limits.
Figure 2
Figure 2
(Panel A): P1 CAEP waveforms (with replications) for both unaided (top) and aided (bottom) P1 testing sessions performed with Case 2 (JF). (Panel B): P1 latencies for testing done with hearing aids (closed squares) and a cochlear implant (closed triangle) plotted by age and compared with the 95% confidence intervals for normal P1 latency development (Sharma et al., 2002c). Results from hearing aid testing are plotted in the no response region at two different ages. Cochlear implant results showed P1 latencies that were within normal limits.
Figure 2
Figure 2
(Panel A): P1 CAEP waveforms (with replications) for both unaided (top) and aided (bottom) P1 testing sessions performed with Case 2 (JF). (Panel B): P1 latencies for testing done with hearing aids (closed squares) and a cochlear implant (closed triangle) plotted by age and compared with the 95% confidence intervals for normal P1 latency development (Sharma et al., 2002c). Results from hearing aid testing are plotted in the no response region at two different ages. Cochlear implant results showed P1 latencies that were within normal limits.
Figure 3
Figure 3
(Panel A): P1 CAEP waveforms (with replications) for three testing sessions (2.53, 3.61, and 4.19 years of age) performed with cochlear implants for Case 3 (RB). Testing at: 2.53 years (top) shows replicable and robust P1 responses; at 3.61 years (middle) show no replicable response; at 4.19 years (bottom) show a somewhat replicable response. (Panel B): P1 latencies from three testing sessions (closed triangles) plotted by age and compared to the 95% confidence intervals for normal P1 latency development (Sharma et al., 2002c). Testing at 2.53 years of age revealed responses with normal latencies, while testing at 3.61 and 4.19 years of age yielded no response and a marginally replicable P1 response that was delayed in latency, respectively.
Figure 3
Figure 3
(Panel A): P1 CAEP waveforms (with replications) for three testing sessions (2.53, 3.61, and 4.19 years of age) performed with cochlear implants for Case 3 (RB). Testing at: 2.53 years (top) shows replicable and robust P1 responses; at 3.61 years (middle) show no replicable response; at 4.19 years (bottom) show a somewhat replicable response. (Panel B): P1 latencies from three testing sessions (closed triangles) plotted by age and compared to the 95% confidence intervals for normal P1 latency development (Sharma et al., 2002c). Testing at 2.53 years of age revealed responses with normal latencies, while testing at 3.61 and 4.19 years of age yielded no response and a marginally replicable P1 response that was delayed in latency, respectively.
Figure 4
Figure 4
P1 CAEP waveforms for individual CAEP recording runs and grand average performed in the aided condition for Case 4 (KG; 1.48 years of age). Upper traces: Waveforms from CAEP runs 1 (212 sweeps), 2 (256 sweeps), and 5 (252 sweeps) show no replicable P1 response, whereas waveforms from runs 3 (266 sweeps) and 4 (265 sweeps) show a robust and replicable P1 response of normal latency for KG’s age. Bottom trace: The waveform marked ‘Grand Average’ is the grand average of all waveforms from the five CAEP recording runs.

References

    1. Bavelier D, Brozinsky C, Tomann A, Mitchell T, Neville H, Liu G. Impact of early deafness and early exposure to sign language on the cerebral organization for motion processing. J Neurosci. 2001;21(22):8931–8942. - PMC - PubMed
    1. Bavelier D, Tomann A, Hutton C, Mitchell T, Corina D, Liu G, Neville H. Visual attention to the periphery is enhanced in congenitally deaf individuals. J Neurosci. 2000;20(17):RC93. - PMC - PubMed
    1. Bergeson TR, Pisoni DB, Davis RA. Development of audiovisual comprehension skills in prelingually deaf children with cochlear implants. Ear Hear. 2005;26(2):149–164. - PMC - PubMed
    1. Berlin C, Bordelon J, St John P, Wilenski D, Annette K, Hood L. Reversing click polarity may uncover auditory neuropathy in infants. Ear Hear. 1998;19(1):37–47. - PubMed
    1. Berlin CI, Li L, Hood LJ, Morlet T, Rose K, Brashears S. Auditory Neuropathy/Dys-Synchrony: After the Diagnosis, then What? Semin Hear. 2002;23(3):209–214.

MeSH terms