

Transformation of postingestive glucose responses after deletion of sweet taste receptor subunits or gastric bypass surgery
- PMID: 22669246
- PMCID: PMC3423100
- DOI: 10.1152/ajpendo.00163.2012
Transformation of postingestive glucose responses after deletion of sweet taste receptor subunits or gastric bypass surgery
Retraction in
-
Retraction.Am J Physiol Endocrinol Metab. 2015 Sep 1;309(5):E500. doi: 10.1152/ajpendo.00000.2015. Am J Physiol Endocrinol Metab. 2015. PMID: 26330403 Free PMC article. No abstract available.
Abstract
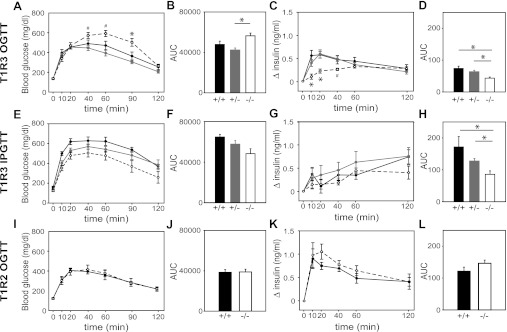
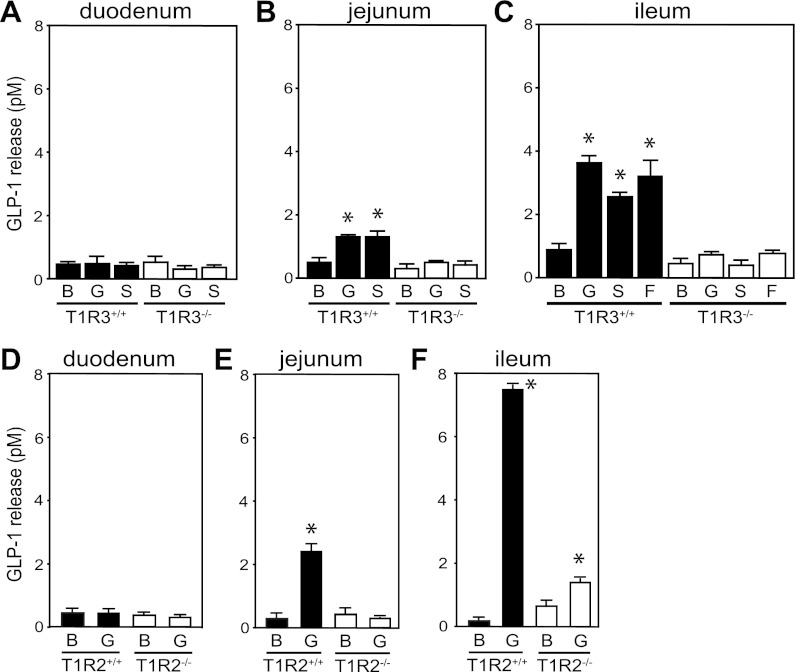
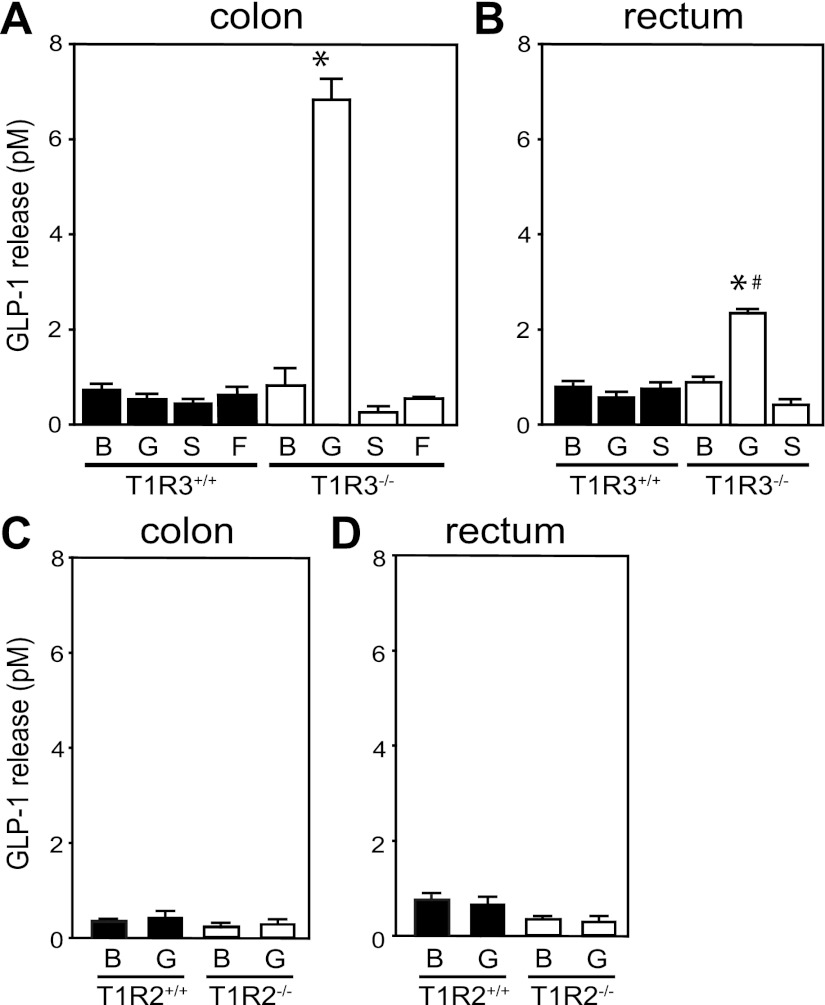
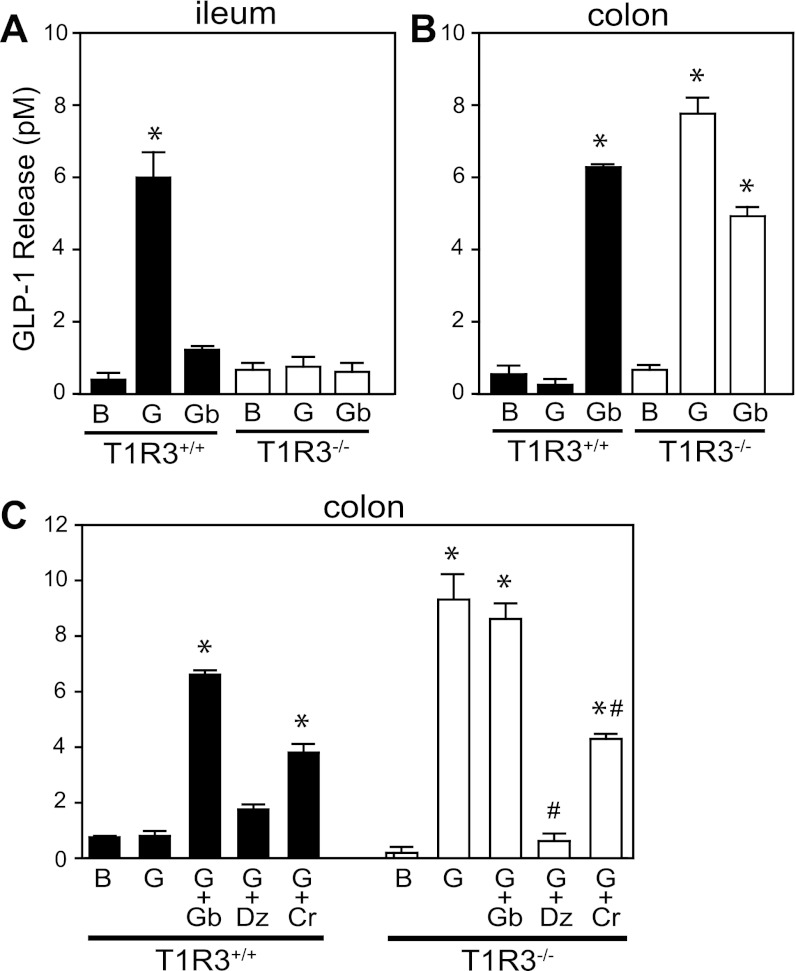
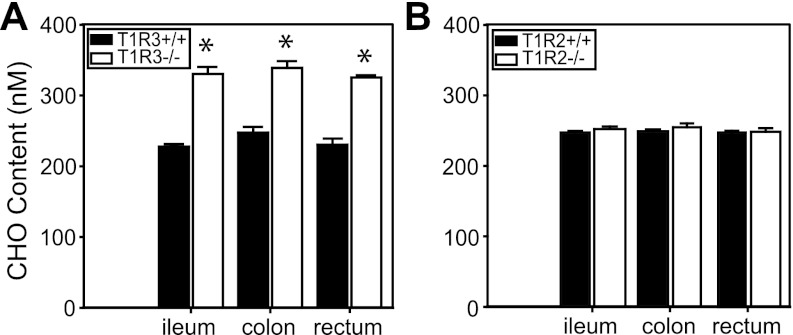
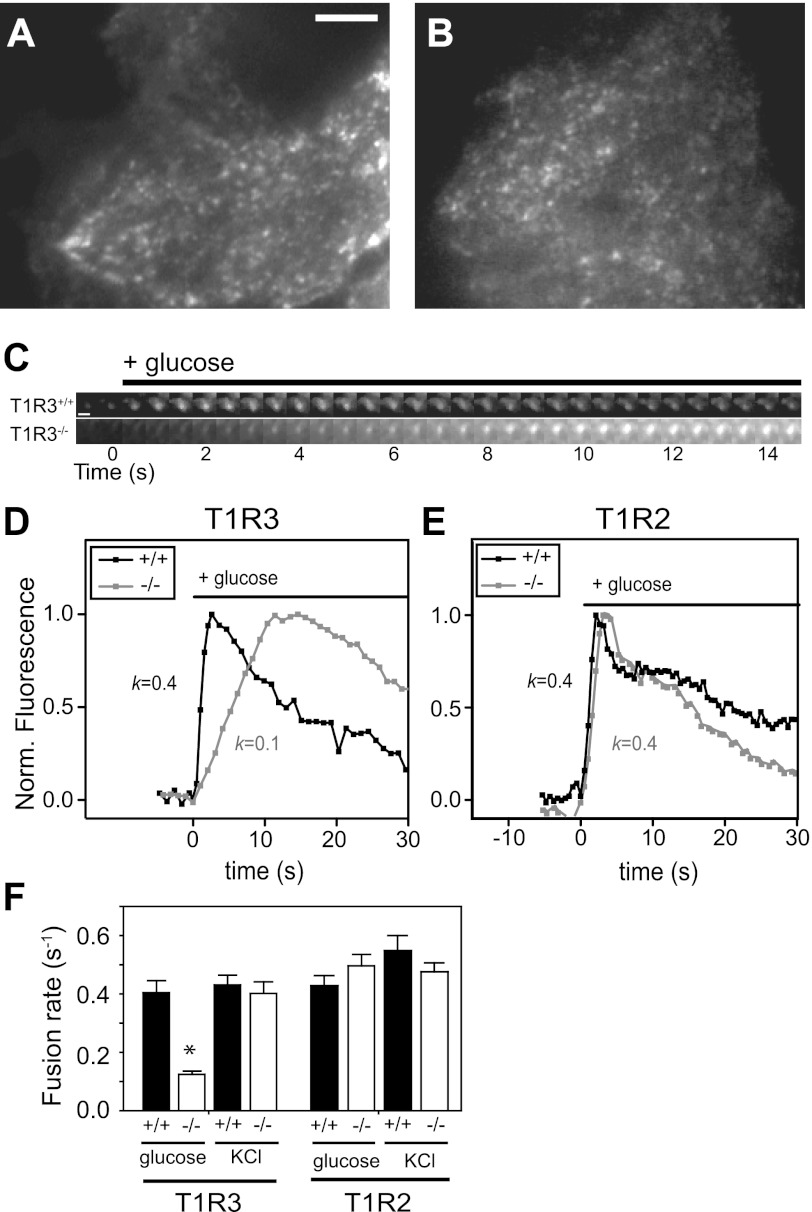
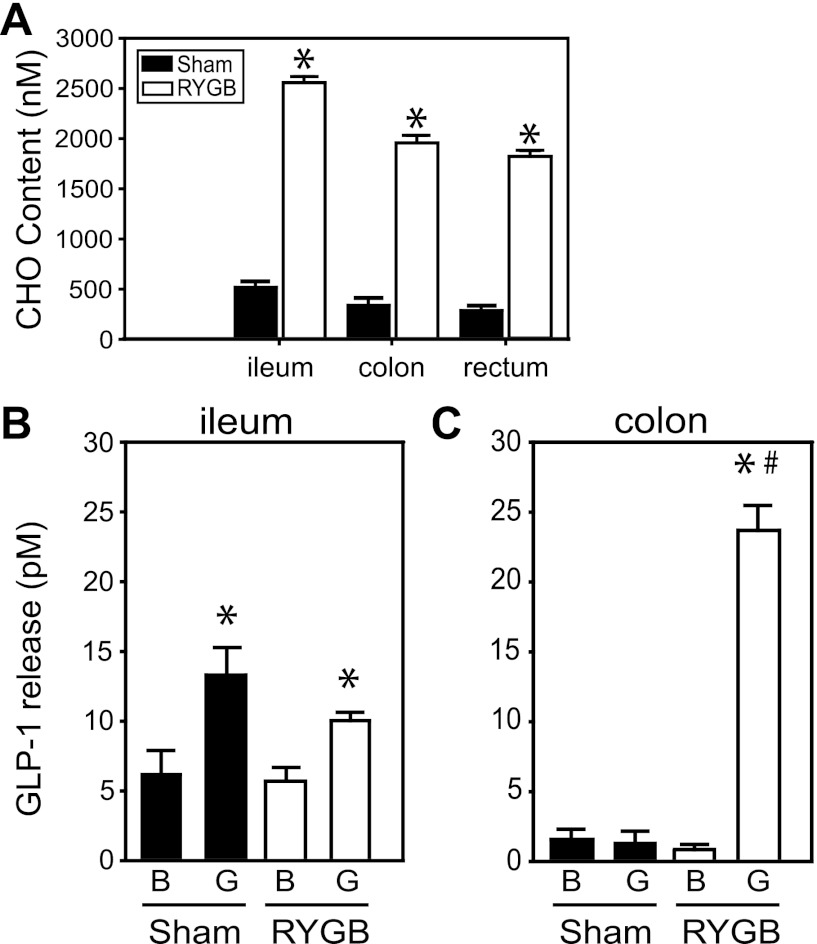
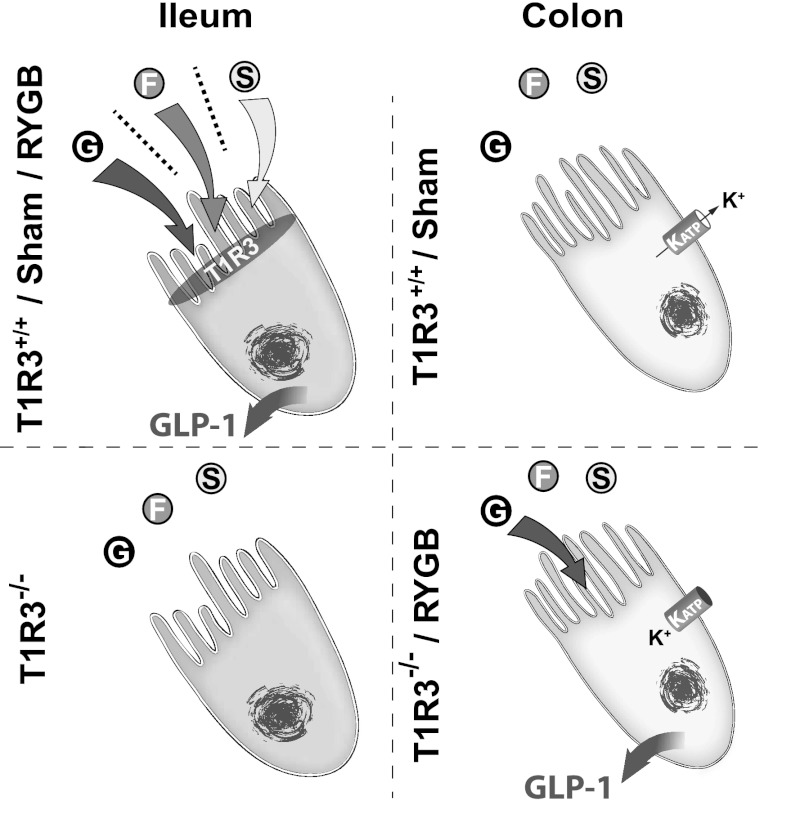
The glucose-dependent secretion of the insulinotropic hormone glucagon-like peptide-1 (GLP-1) is a critical step in the regulation of glucose homeostasis. Two molecular mechanisms have separately been suggested as the primary mediator of intestinal glucose-stimulated GLP-1 secretion (GSGS): one is a metabotropic mechanism requiring the sweet taste receptor type 2 (T1R2) + type 3 (T1R3) while the second is a metabolic mechanism requiring ATP-sensitive K(+) (K(ATP)) channels. By quantifying sugar-stimulated hormone secretion in receptor knockout mice and in rats receiving Roux-en-Y gastric bypass (RYGB), we found that both of these mechanisms contribute to GSGS; however, the mechanisms exhibit different selectivity, regulation, and localization. T1R3(-/-) mice showed impaired glucose and insulin homeostasis during an oral glucose challenge as well as slowed insulin granule exocytosis from isolated pancreatic islets. Glucose, fructose, and sucralose evoked GLP-1 secretion from T1R3(+/+), but not T1R3(-/-), ileum explants; this secretion was not mimicked by the K(ATP) channel blocker glibenclamide. T1R2(-/-) mice showed normal glycemic control and partial small intestine GSGS, suggesting that T1R3 can mediate GSGS without T1R2. Robust GSGS that was K(ATP) channel-dependent and glucose-specific emerged in the large intestine of T1R3(-/-) mice and RYGB rats in association with elevated fecal carbohydrate throughout the distal gut. Our results demonstrate that the small and large intestines utilize distinct mechanisms for GSGS and suggest novel large intestine targets that could mimic the improved glycemic control seen after RYGB.
Figures
Comment in
-
Findings of research misconduct.NIH Guide Grants Contracts (Bethesda). 2015 Nov 20:NOT-OD-16-020. NIH Guide Grants Contracts (Bethesda). 2015. PMID: 26601328 Free PMC article. No abstract available.
-
Findings of Research Misconduct.Fed Regist. 2015 Oct 29;80(209):66546. Fed Regist. 2015. PMID: 27737265 Free PMC article. No abstract available.
Similar articles
-
Glucose-Sensing Receptor T1R3: A New Signaling Receptor Activated by Glucose in Pancreatic β-Cells.Biol Pharm Bull. 2015;38(5):674-9. doi: 10.1248/bpb.b14-00895. Biol Pharm Bull. 2015. PMID: 25947913
-
Glucose transporters and ATP-gated K+ (KATP) metabolic sensors are present in type 1 taste receptor 3 (T1r3)-expressing taste cells.Proc Natl Acad Sci U S A. 2011 Mar 29;108(13):5431-6. doi: 10.1073/pnas.1100495108. Epub 2011 Mar 7. Proc Natl Acad Sci U S A. 2011. PMID: 21383163 Free PMC article.
-
Metabolic responses to xenin-25 are altered in humans with Roux-en-Y gastric bypass surgery.Peptides. 2016 Aug;82:76-84. doi: 10.1016/j.peptides.2016.06.001. Epub 2016 Jun 7. Peptides. 2016. PMID: 27288245 Free PMC article. Clinical Trial.
-
Mechanisms of improved glycaemic control after Roux-en-Y gastric bypass.Dan Med J. 2015 Apr;62(4):B5057. Dan Med J. 2015. PMID: 25872541 Review.
-
An alternative pathway for sweet sensation: possible mechanisms and physiological relevance.Pflugers Arch. 2020 Dec;472(12):1667-1691. doi: 10.1007/s00424-020-02467-1. Epub 2020 Oct 8. Pflugers Arch. 2020. PMID: 33030576 Review.
Cited by
-
Loss of the nutrient receptor Tas1R3 reduces atherosclerotic plaque accumulation and hepatic steatosis in ApoE-/- mice.J Physiol Biochem. 2020 Nov;76(4):623-636. doi: 10.1007/s13105-020-00768-8. Epub 2020 Oct 9. J Physiol Biochem. 2020. PMID: 33033981
-
Carbohydrate-induced secretion of glucose-dependent insulinotropic polypeptide and glucagon-like peptide-1.J Diabetes Investig. 2016 Apr;7 Suppl 1(Suppl 1):27-32. doi: 10.1111/jdi.12449. Epub 2016 Mar 14. J Diabetes Investig. 2016. PMID: 27186352 Free PMC article. Review.
-
A subset of mouse colonic goblet cells expresses the bitter taste receptor Tas2r131.PLoS One. 2013 Dec 18;8(12):e82820. doi: 10.1371/journal.pone.0082820. eCollection 2013. PLoS One. 2013. PMID: 24367558 Free PMC article.
-
Sweet Taste Is Complex: Signaling Cascades and Circuits Involved in Sweet Sensation.Front Hum Neurosci. 2021 Jun 22;15:667709. doi: 10.3389/fnhum.2021.667709. eCollection 2021. Front Hum Neurosci. 2021. PMID: 34239428 Free PMC article. Review.
-
Glucose Evokes Rapid Ca2+ and Cyclic AMP Signals by Activating the Cell-Surface Glucose-Sensing Receptor in Pancreatic β-Cells.PLoS One. 2015 Dec 2;10(12):e0144053. doi: 10.1371/journal.pone.0144053. eCollection 2015. PLoS One. 2015. PMID: 26630567 Free PMC article.
References
-
- Ackroff K, Sclafani A. Palatability and foraging cost interact to control caloric intake. J Exp Psychol Anim Behav Process 25: 28–36, 1999 - PubMed
-
- Bezencon C, le Coutre J, Damak S. Taste-signaling proteins are coexpressed in solitary intestinal epithelial cells. Chem Senses 32: 41–49, 2007 - PubMed
Publication types
MeSH terms
Substances
Grants and funding
LinkOut - more resources
Full Text Sources
Molecular Biology Databases
Research Materials