. 2012 Jun 5;5(227):ra41.
doi: 10.1126/scisignal.2003002.

Matrix rigidity controls endothelial differentiation and morphogenesis of cardiac precursors

Affiliations

Matrix rigidity controls endothelial differentiation and morphogenesis of cardiac precursors

Kshitiz et al. Sci Signal. .

Erratum in

Abstract

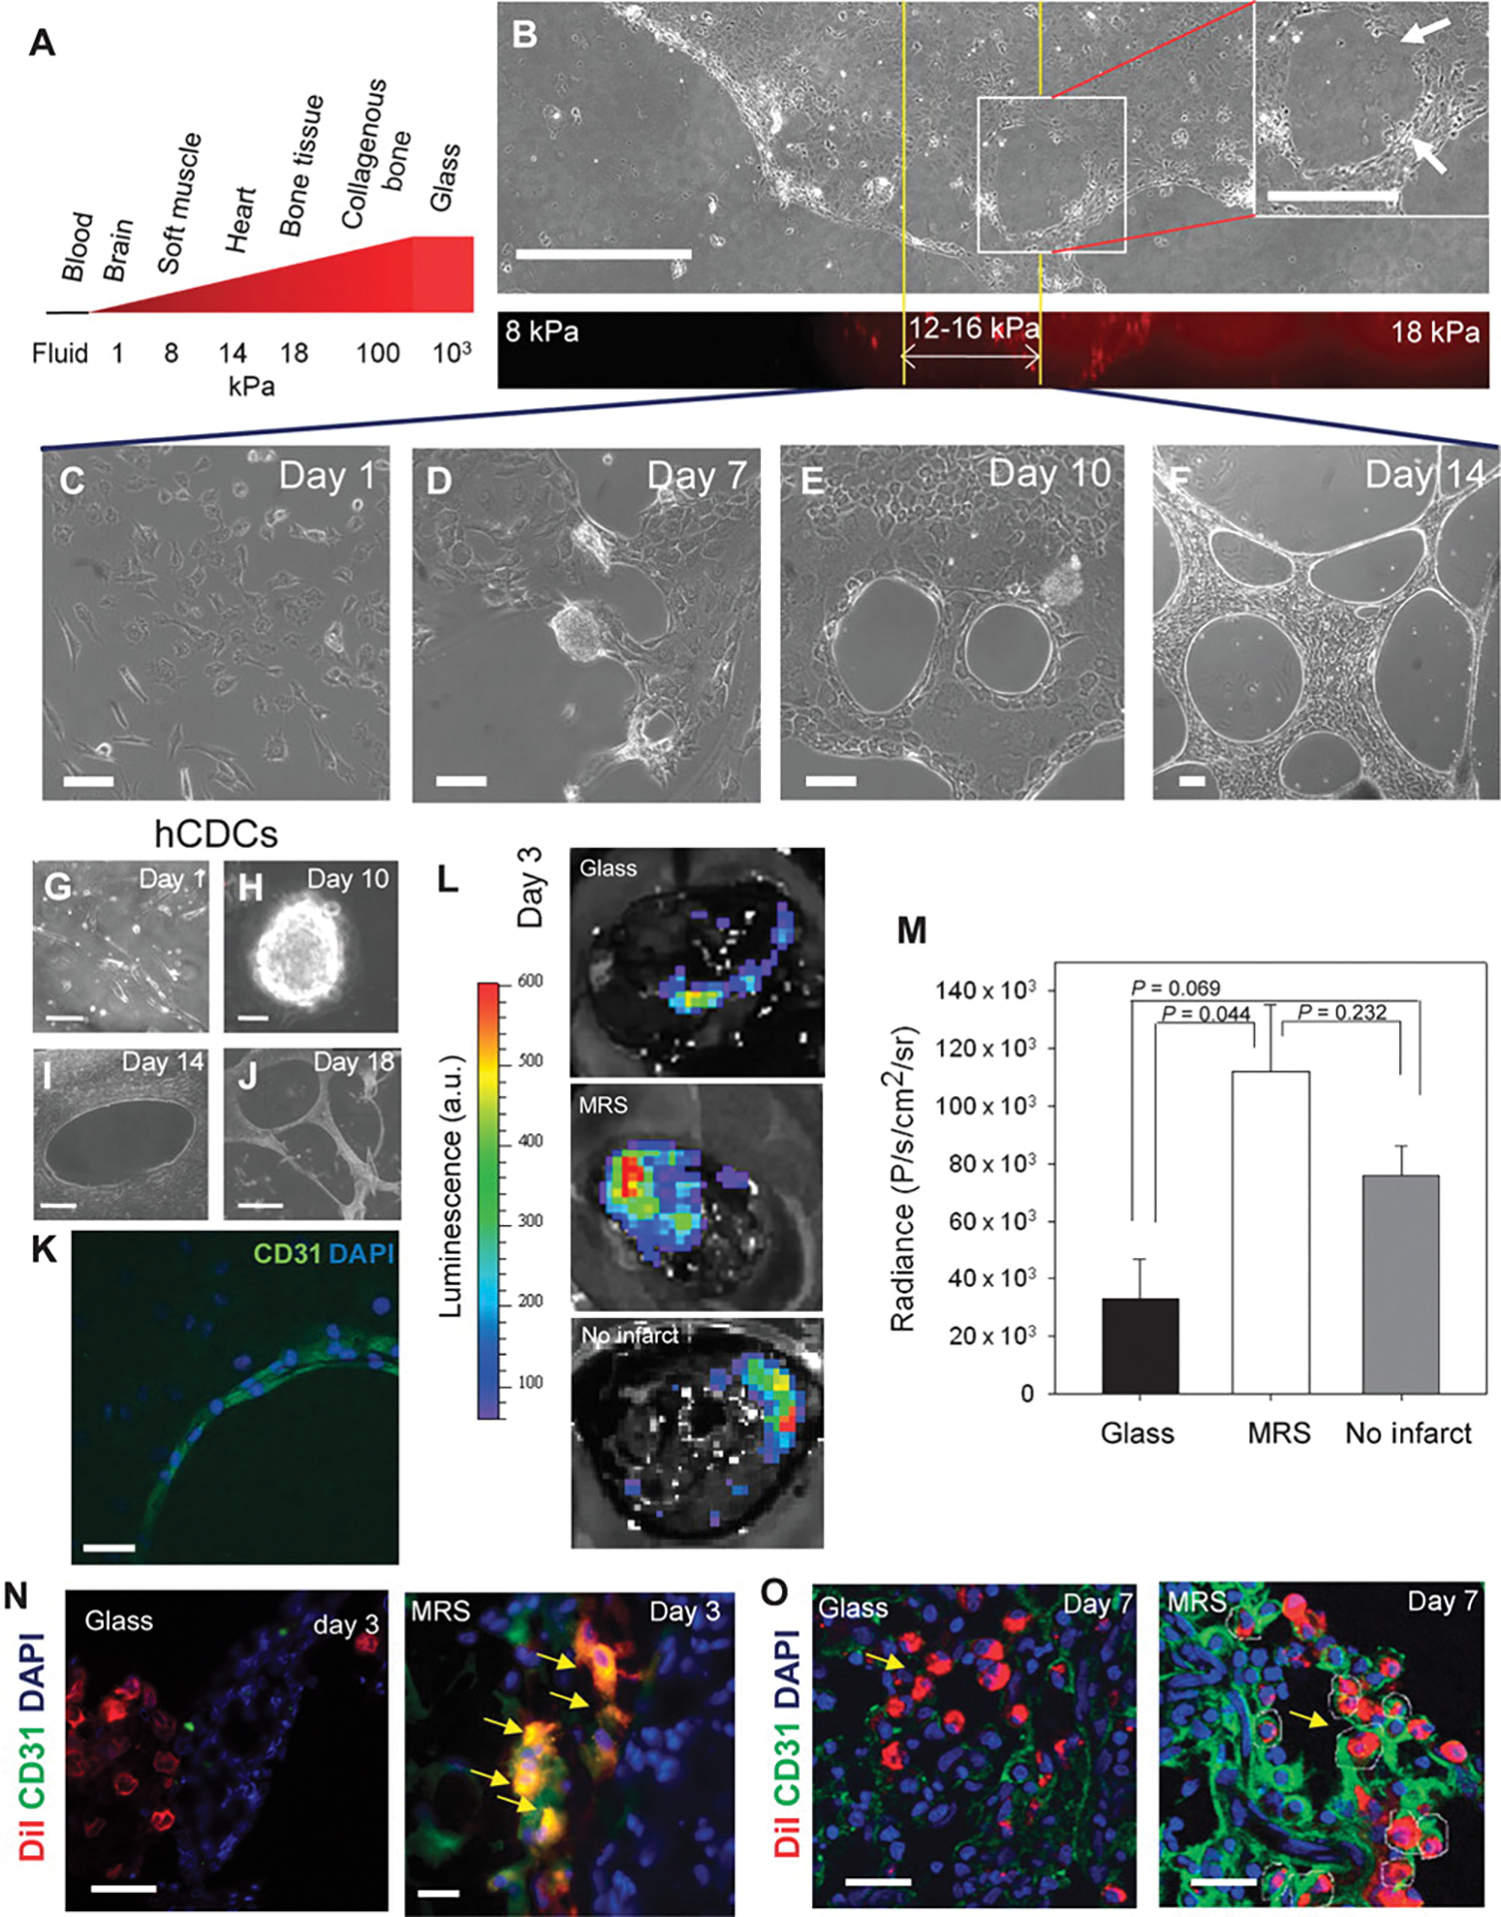
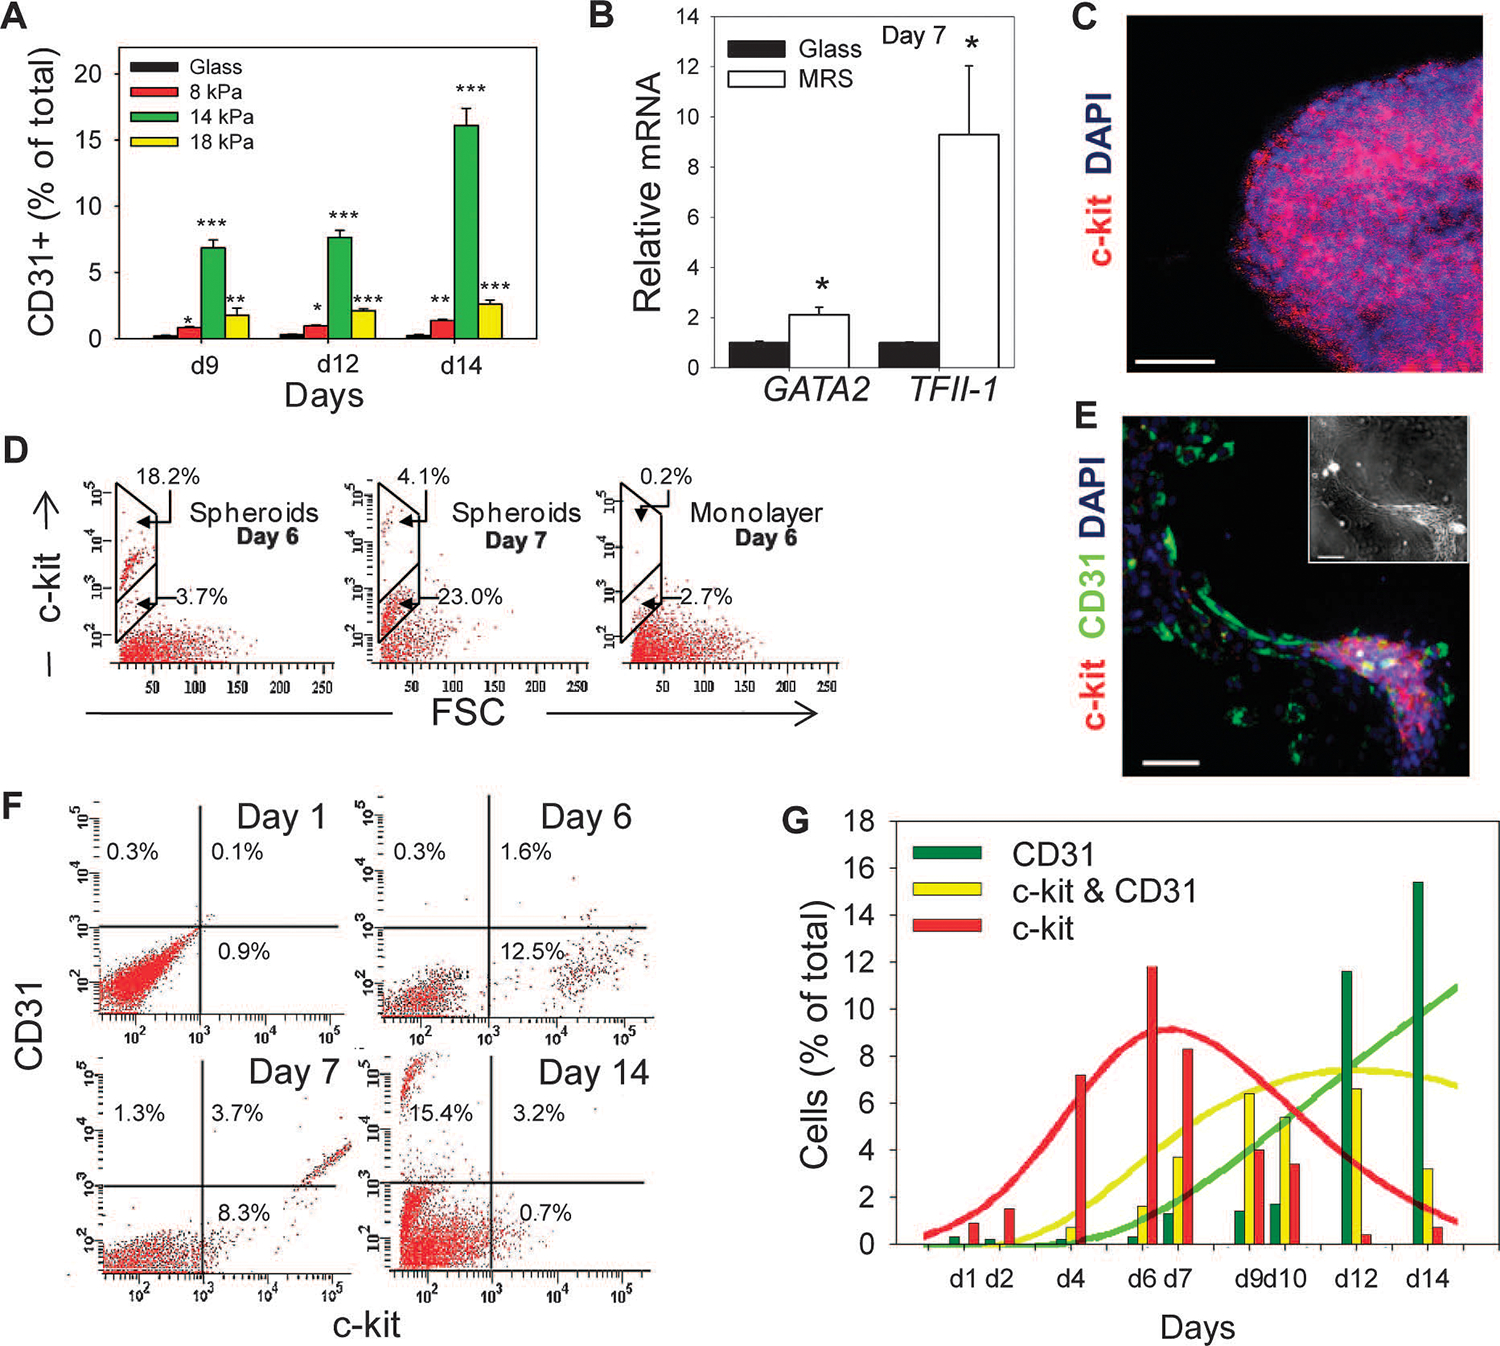
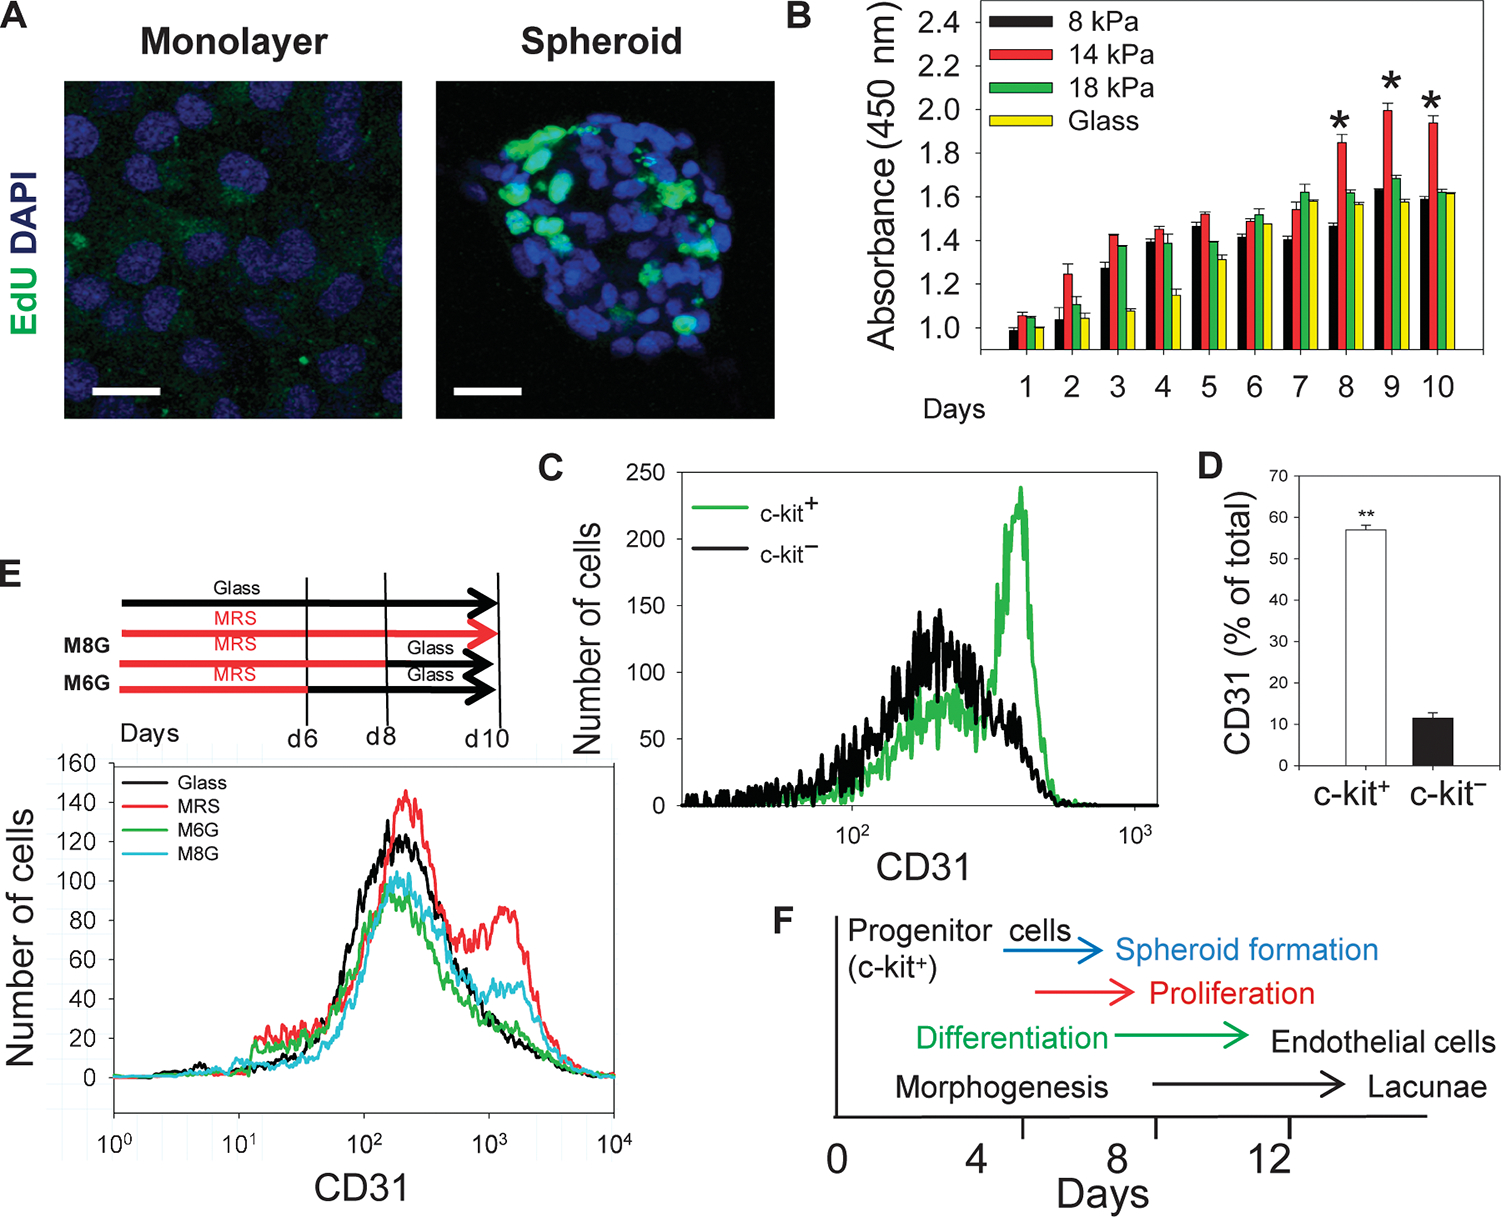
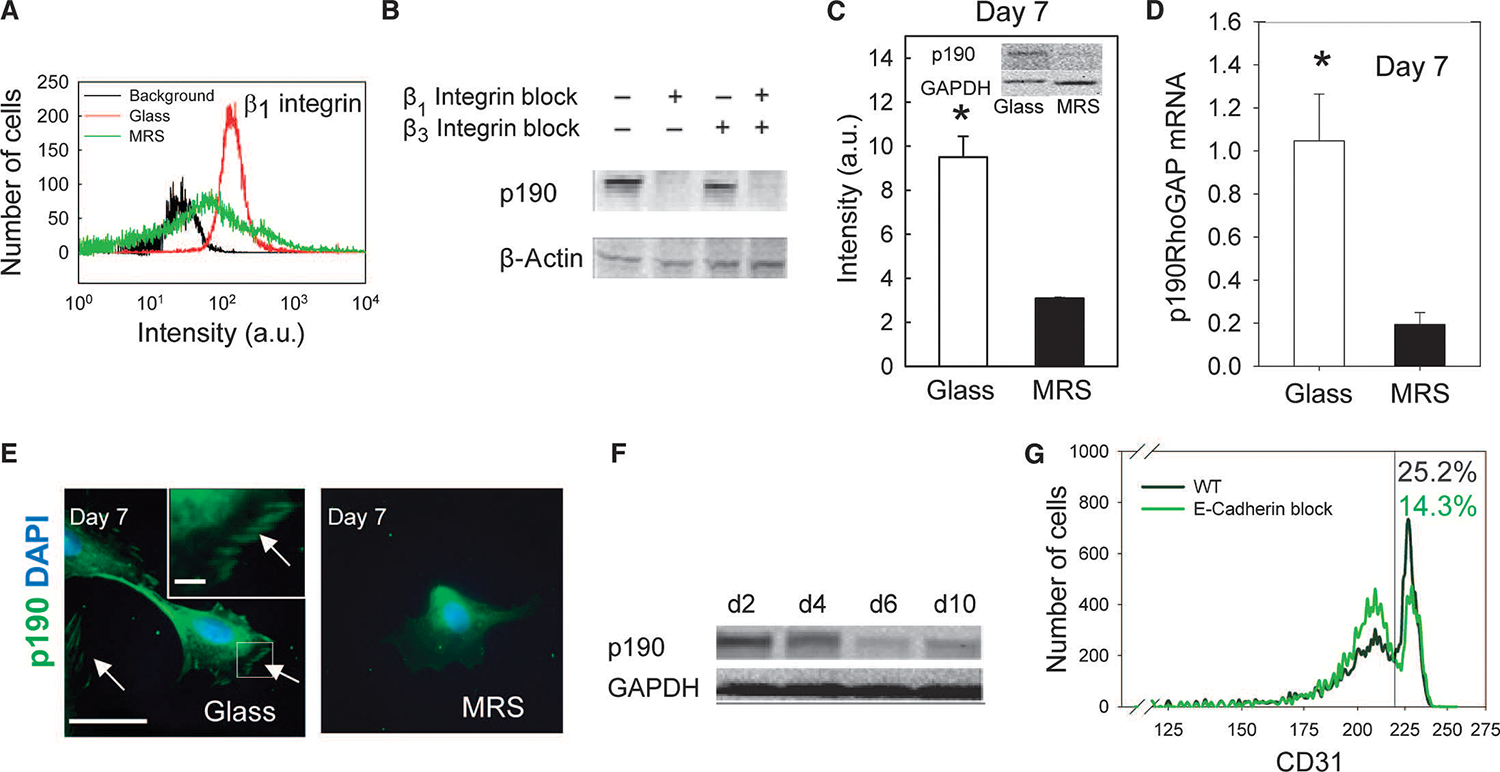
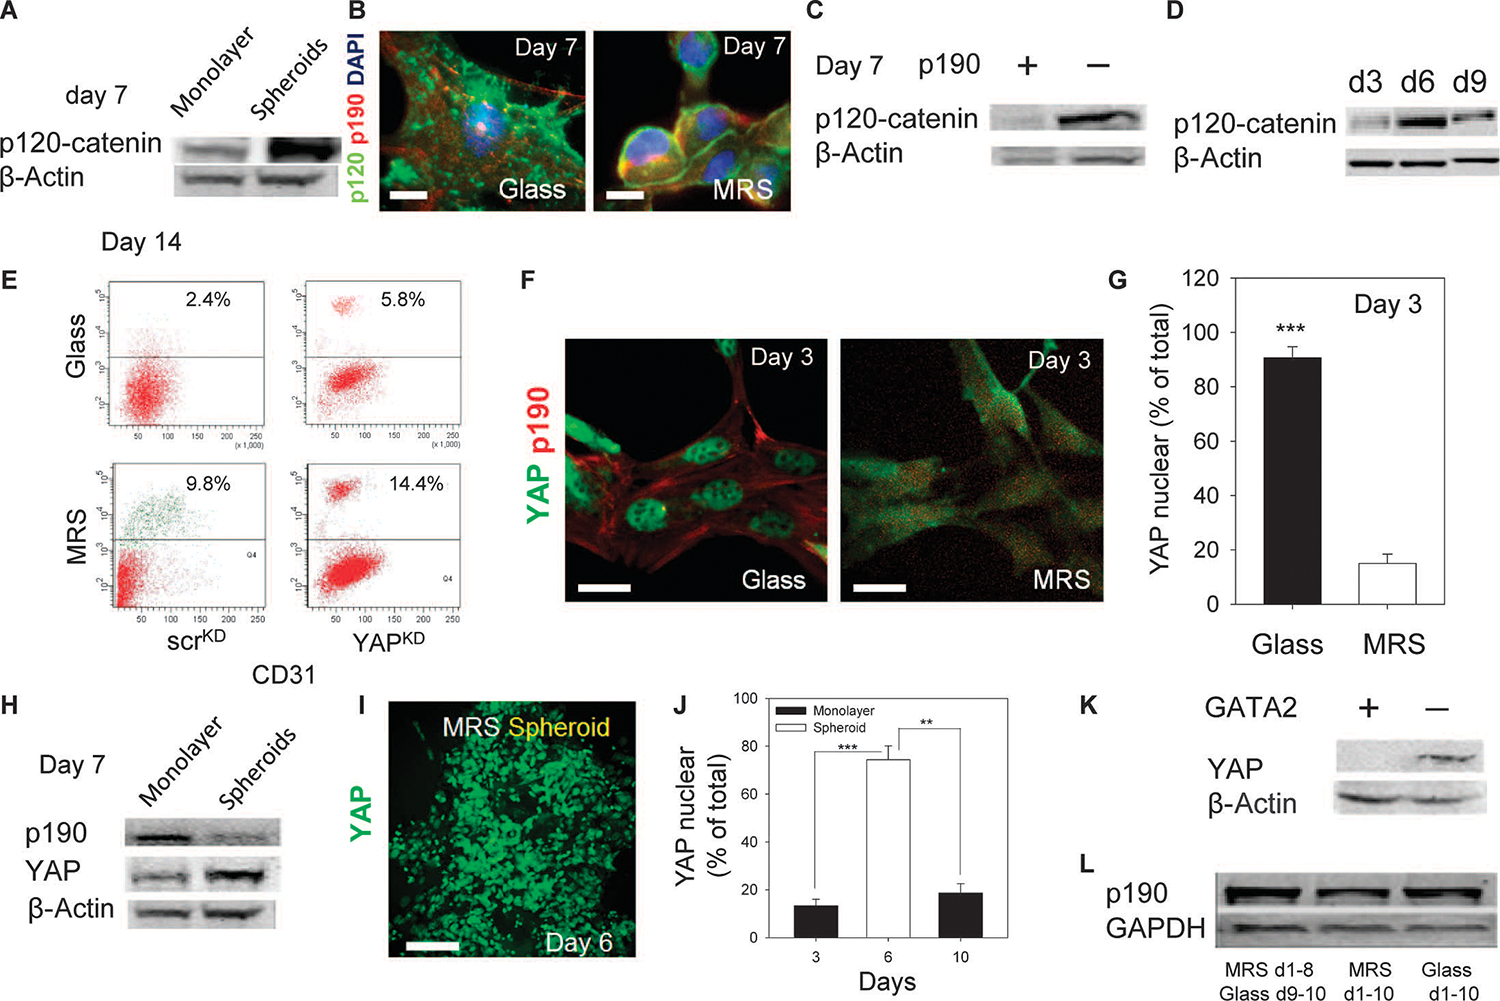
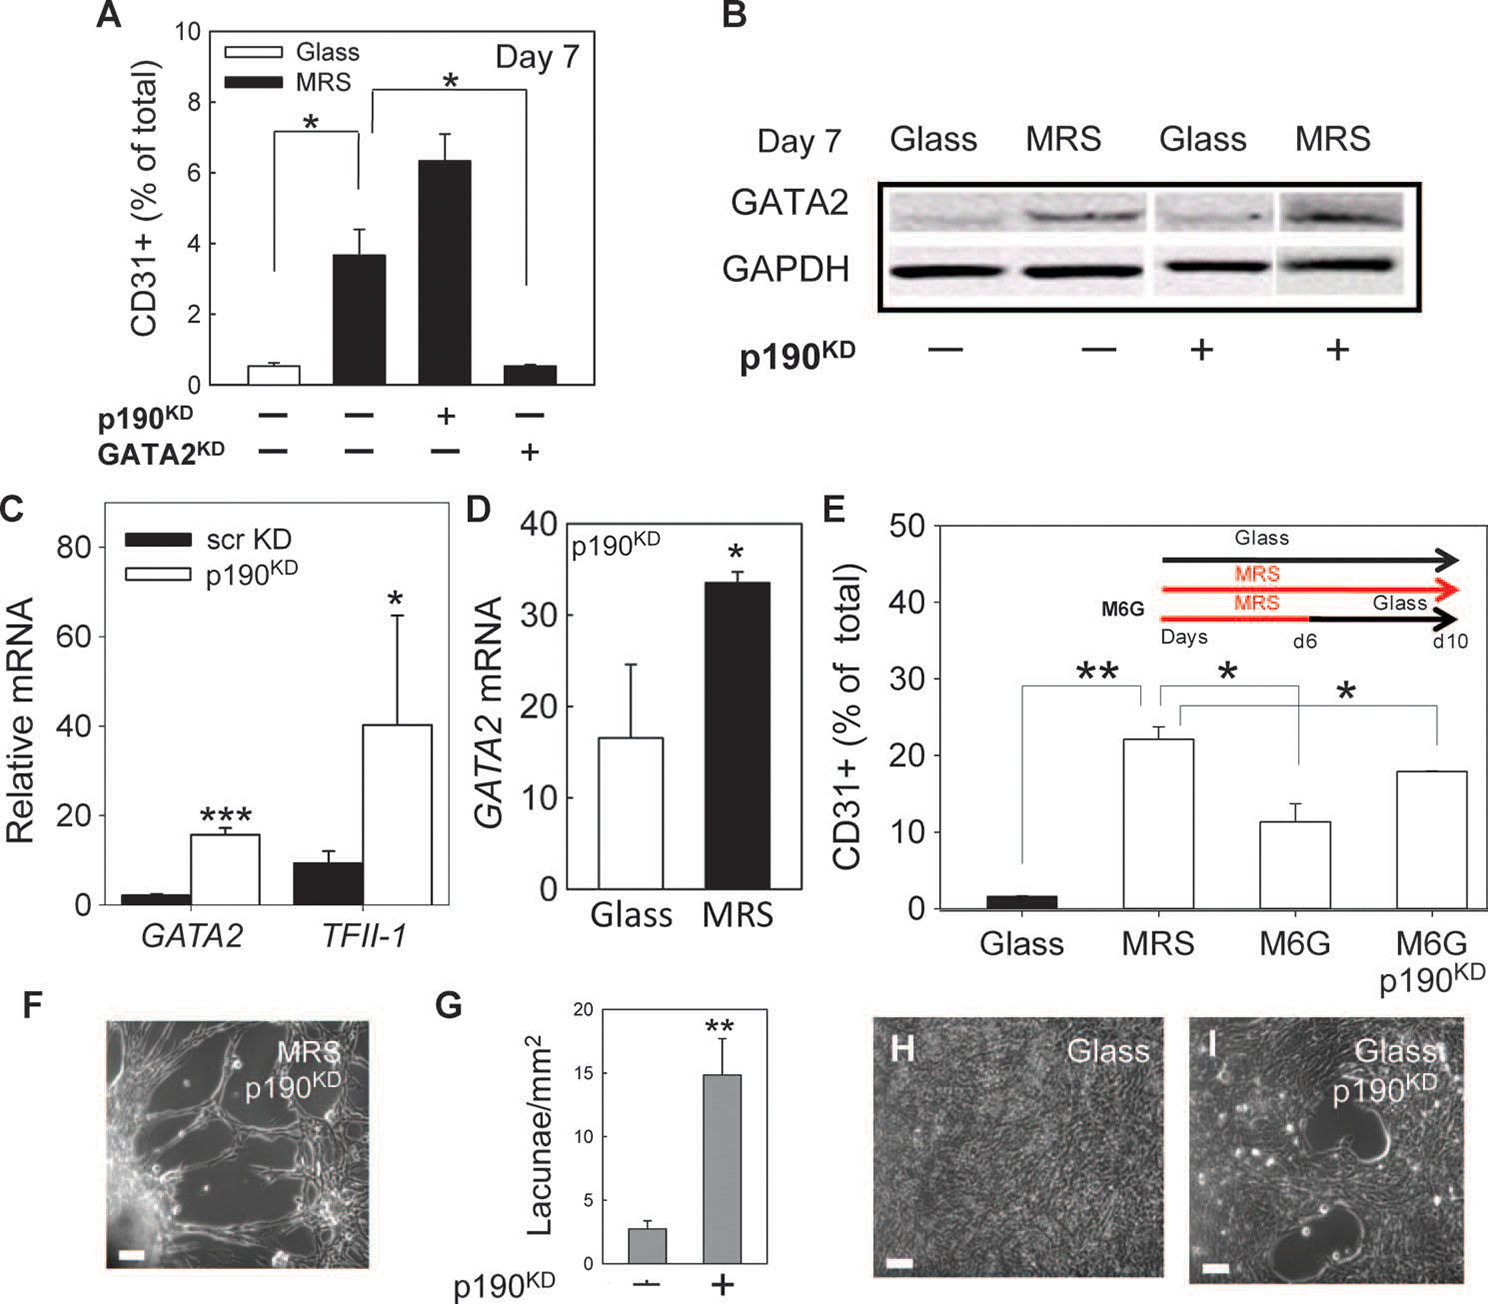
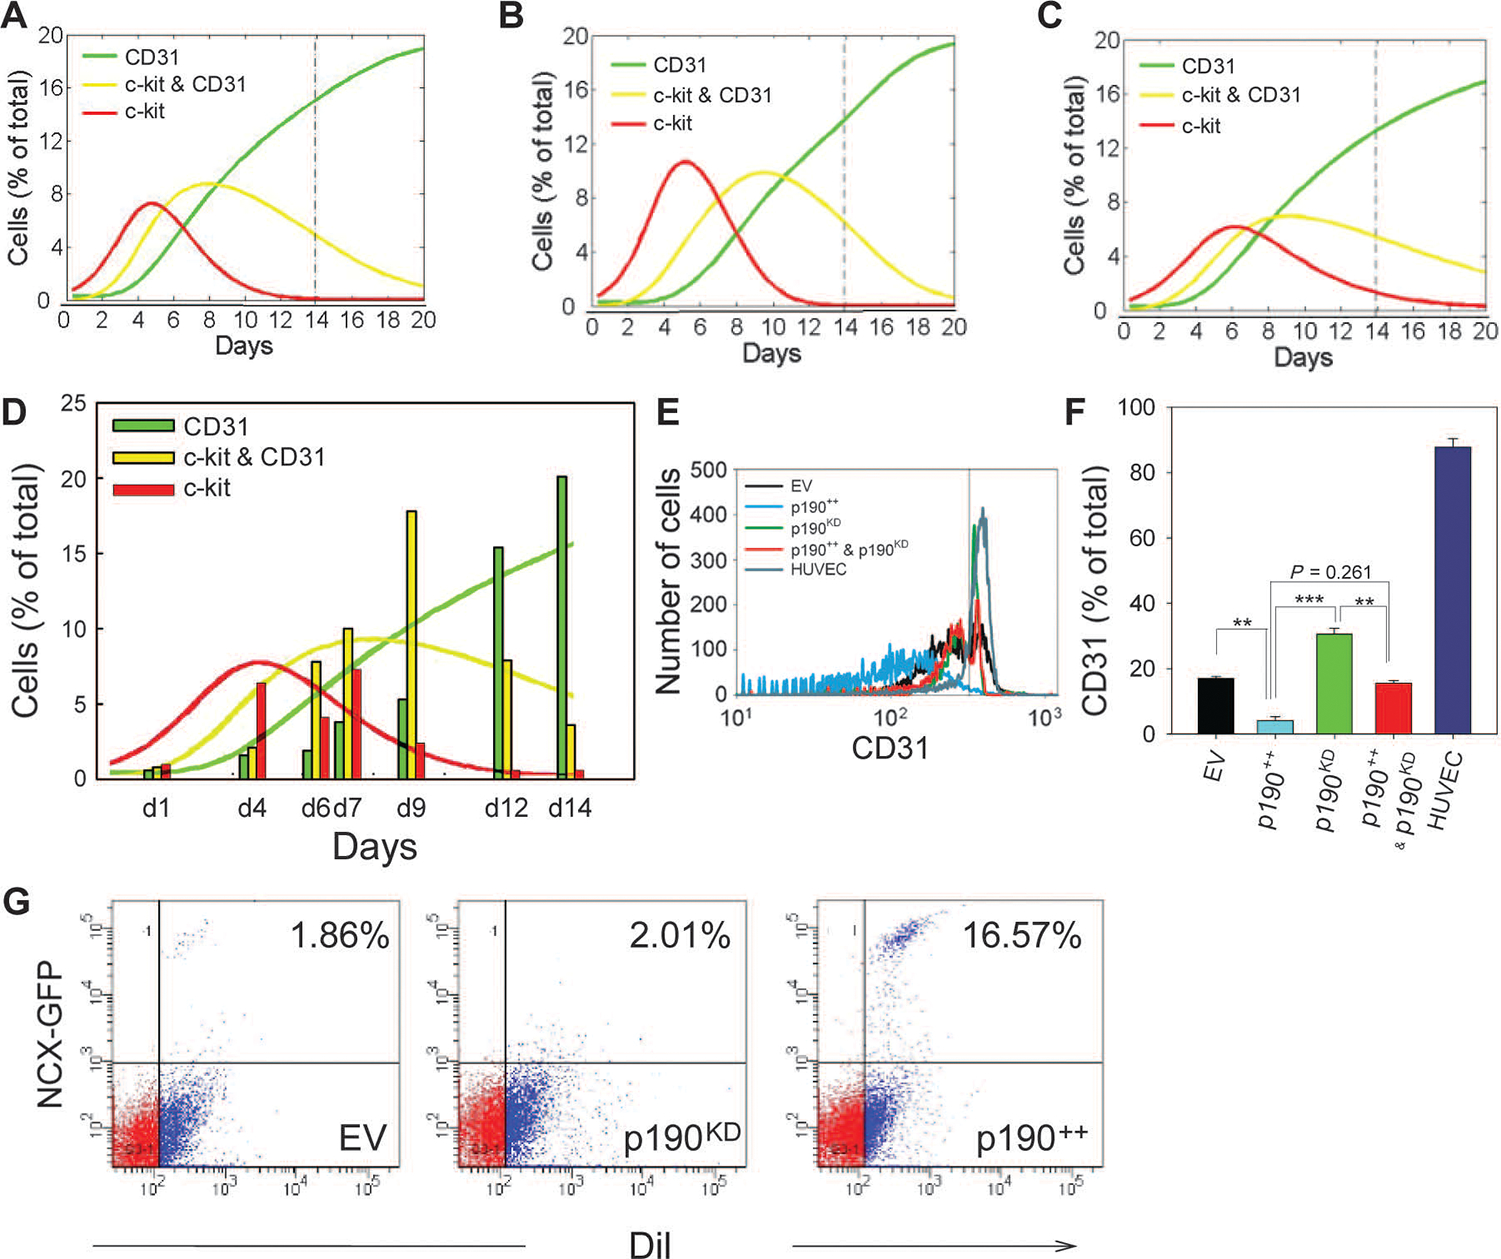
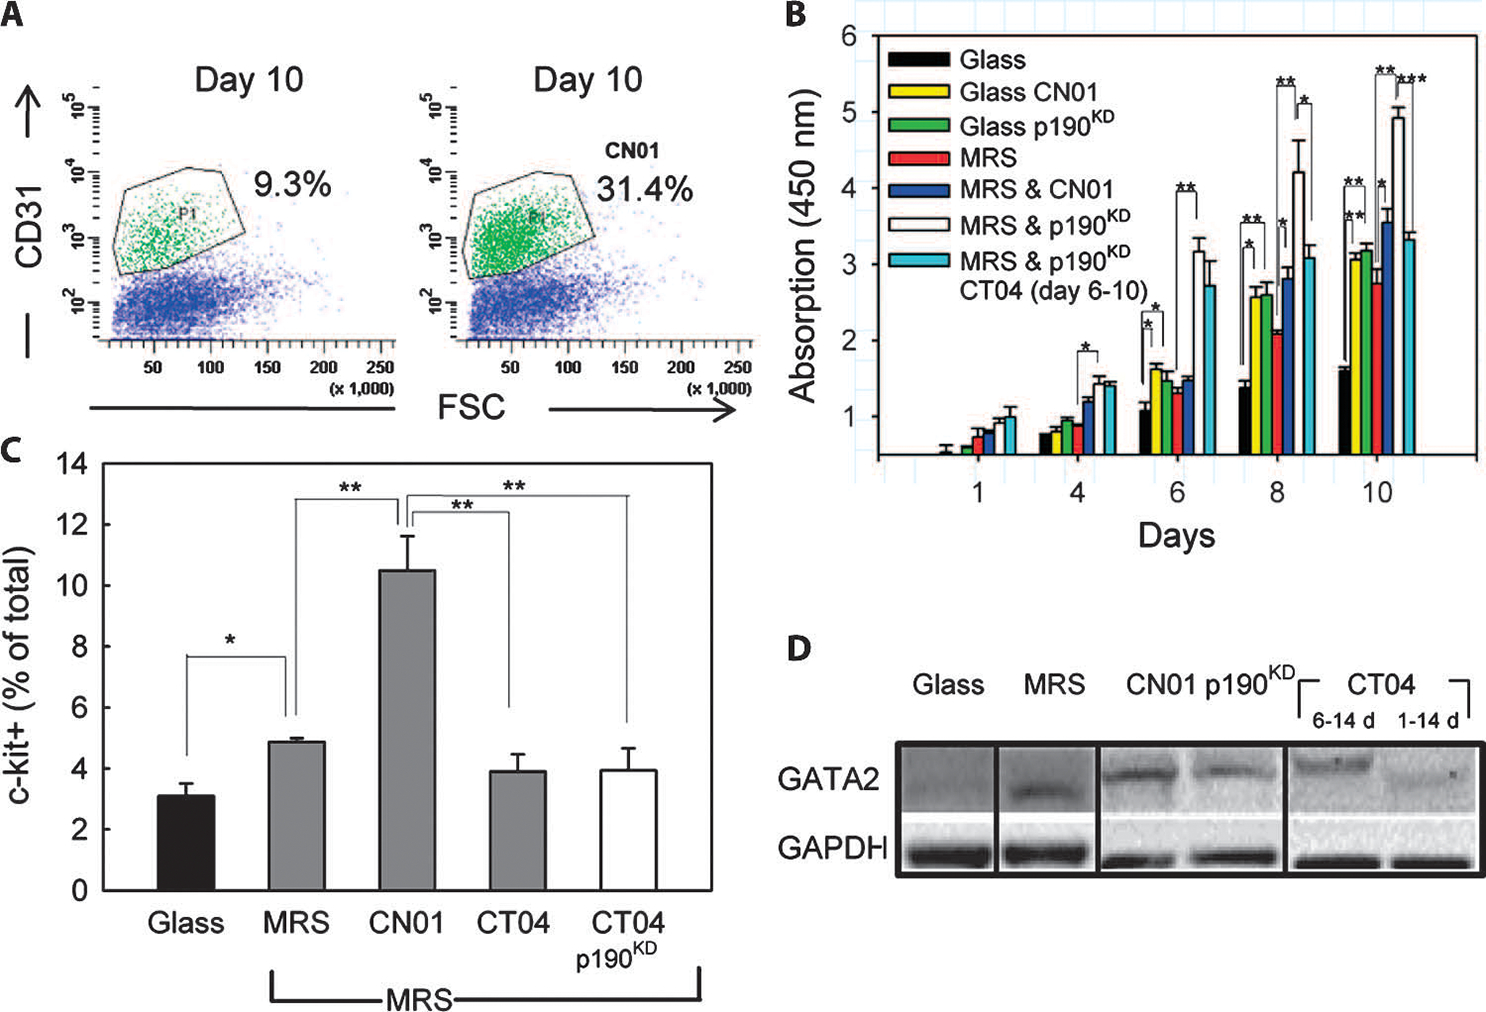
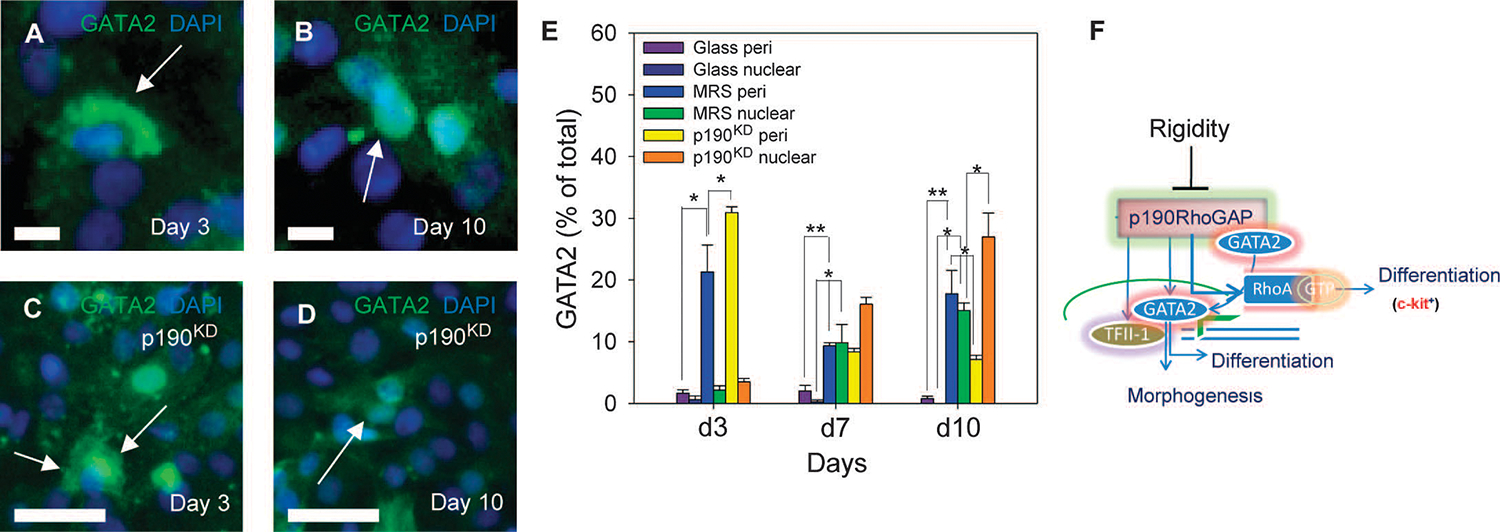
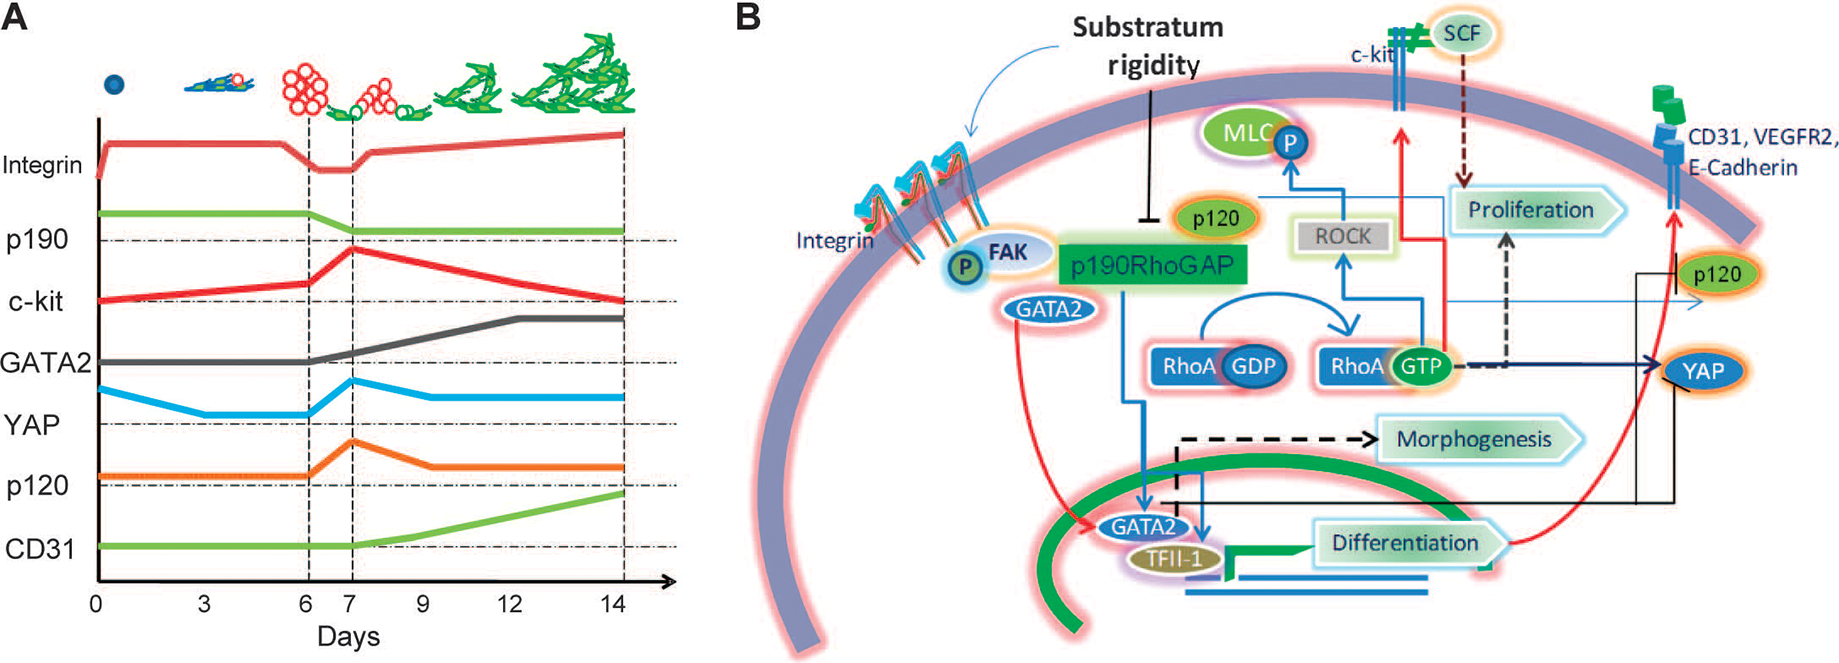
Tissue development and regeneration involve tightly coordinated and integrated processes: selective proliferation of resident stem and precursor cells, differentiation into target somatic cell type, and spatial morphological organization. The role of the mechanical environment in the coordination of these processes is poorly understood. We show that multipotent cells derived from native cardiac tissue continually monitored cell substratum rigidity and showed enhanced proliferation, endothelial differentiation, and morphogenesis when the cell substratum rigidity closely matched that of myocardium. Mechanoregulation of these diverse processes required p190RhoGAP, a guanosine triphosphatase-activating protein for RhoA, acting through RhoA-dependent and -independent mechanisms. Natural or induced decreases in the abundance of p190RhoGAP triggered a series of developmental events by coupling cell-cell and cell-substratum interactions to genetic circuits controlling differentiation.


Figures

Fig. 1.
Fig. 1.
Rat CDCs undergo complex morphogenesis suggestive of endothelial differentiation when cultured on the substratum with rigidity matching that of the heart tissue. (A) Schematic showing approximate substratum rigidities of living tissues. (B) CDCs cultured for 10 days on polyacrylamide substratum with a spatial rigidity gradient form lacunae only in the rigidity range of 12 to 16 kPa. (C to F) Time-lapsed images of CDCs cultured on polyacrylamide gels of 14-kPa rigidity (MRS). (G to J) Time-lapsed images of human CDCs (hCDCs) cultured on MRS. (K) Confocal image of CD31-positive cells (green) lining lacunae. DAPI, 4′,6-diamidino-2-phenylindole. (L) Bioluminescence intensities of CDCs expressing lv-luciferase cultured on glass (left) and on MRS (center) for 7 days before injecting in infarcted rat and in healthy rat heart (right). a.u., arbitrary units. (M) Quantification of bioluminescence radiance in (I). Error bars, SEM; n = 3 rats. Statistical significance measured by paired t tests. (N and O) CDCs precultured on MRS integrate into blood vessels of rat heart. Representative images of DiI+ CDCs precultured on glass, or MRS for 7 days before injection at the site of myocardial infarct in rats. Images were acquired 3 days (N) and 7 days (O) after injection. DiI+CD31+ CDCs observed in 66% of sections analyzed for (N) (n = 12 from 3 rats) and in 25% of sections analyzed for (O) (n = 12 from 3 rats). Yellow arrowheads show DiI+CD31+ CDCs integrated in a lumen. Scale bars, 250 μm (A), 20 μm (C to F), 50 μm (G, K, N, and O), 100 μm (H), 250 μm (I), and 1 μm (J).
Fig. 2.
Fig. 2.
Substratum rigidity directs endothelial differentiation of CDCs. (A) Time course flow cytometric analysis of CDCs cultured on substrata of different rigidities. (B) Reverse transcription–PCR (RT-PCR) analysis of GATA2 and TFII-1 abundance in CDCs cultured on MRS and on glass. (C) Confocal microscopy shows high abundance of c-kit in spheroids. (D) Distribution of c-kit+ cells in CDCs cultured on MRS in mechanically isolated spheres 6 days (left) and 7 days (center) after cell seeding and from remaining adherent cells (right). (E) Immunostaining of CDCs cultured on MRS for 7 days for c-kit in cell aggregates and for CD31 in lacunae-forming cells (see inset for phase contrast). (F and G) Time course flow cytometric analysis of c-kit and CD31 abundance in CDCs cultured on MRS (F). Results quantified in (G) as percentages of c-kit+/CD31 (green), c-kit+/CD31+ (yellow), and c-kit/CD31+ (red) cells in the total population (bars; based on the quadrant definition in (F). Results of the computational simulation of CDC proliferation and differentiation color-coded similarly (n = 2 cultures). Scale bars, 50 μm (C and E). *P < 0.05; **P < 0.01; ***P < 0.001. Error bars, SEM.
Fig. 3.
Fig. 3.
A persistent rigidity cue is required for proliferation and endothelial differentiation of CDCs. (A) Confocal imaging of EdU staining in CDCs in a monolayer and a spheroid. Scale bars, 20 μm. (B) CDCs cultured on MRS, but not substrata, of different rigidities show a sudden increase in proliferation as assessed by the WST-8 assay. (C) Flow cytometric analysis of CD31 abundance after 7 days of culture on MRS in c-kit+ and c-kit sorted cells from CDCs cultured on MRS for 7 days. (D) Quantification of (C). (E) Persistent rigidity sensing is required for differentiation. Schematic of experimental procedure. (Top) CDCs were cultured on MRS or on glass for 10 days (Glass) and on MRS for 6 days (M6G) and 8 days (M8G) followed by transfer onto glass for the remainder of the 10-day period. (Bottom) Experimental results of CD31 flow cytometry. (F) Schematic summarizing the time distribution of spheroid formation, cell proliferation, differentiation, and cell network morphogenesis. *P < 0.05; **P < 0.01. Error bars, SEM.
Fig. 4.
Fig. 4.
Substratum rigidity regulates focal adhesion–mediated RhoA and p190RhoGAP signaling. (A) Flow cytometric analysis of β1 integrin in CDCs after 3 days of culture. (B) Immunoblotting of p190RhoGAP in CDCs cultured on glass in the presence of blocking antibodies against β1 or β3 integrin for 3 days. β-Actin was used as the control. (C) Immunoblotting analysis of p190RhoGAP in CDCs cultured on MRS or glass for 7 days. Representative bands shown in inset. n = 3. (D) RT-PCR analysis of p190RhoGAP mRNA in CDCs. (E) Immunostaining of p190RhoGAP in CDCs on glass (left) or MRS (right) 7 days after seeding; localized staining indicated by arrows. n = 4 cultures for each condition. Scale bars, 50 μm. (F) Immunoblotting analysis of p190RhoGAP in CDCs cultured on MRS for different periods of time. Lower panel shows GAPDH control. (G) Flow cytometric analysis of CD31 abundance in CDCs cultured on MRS without (control, green) and with neutralizing E-cadherin antibody (black). Quantification of gated CD31+ cells shown in inset. n = 3 samples. *P < 0.05. Error bars, SEM.
Fig. 5.
Fig. 5.
Substratum rigidity regulates the abundance and localization of p120-catenin and YAP. (A) p120-catenin abundance in CDCs cultured on MRS in spheroids, and remaining adherent cells. (B) Immunostaining for p120-catenin and p190RhoGAP in CDCs cultured on glass (left) or on MRS (right). Colocalization analysis is shown in fig. S4E. (C) p120-catenin abundance in CDCs transfected with control scrambled small interfering RNAs (siRNAs) (scrKD) or siRNAs directed against p190RhoGAP (p190KD). (D) Time course analysis of p120-catenin abundance in CDCs cultured on MRS. (E) Flow cytometric analysis of CD31 in scrKD and YAPKD CDCs. n = 2 cultures. (F) Immunostaining reveals that YAP has a predominantly nuclear localization in CDCs cultured on glass and a cytosolic distribution in CDCs cultured on MRS. (G) Quantification of nuclear localization in (F). n = 3 samples. (H) Analysis of p190RhoGAP, YAP, and p120-catenin abundance in cell monolayers and spheroid cell aggregates cultured on MRS. (I) Two-photon imaging of YAP in a CDC spheroid. (J) Quantification of nuclear localization of YAP. (K) Immunoblotting analysis of YAP in scrKD and GATA2KD CDCs. (L) p190RhoGAP abundance in CDCs cultured on MRS for 8 days followed by 2 days on glass, or cells cultured on MRS and glass for 10 days. Scale bars, 20 μm (B and F) and 100 μm (I). P values determined by paired t tests, **P < 0.01; ***P < 0.001. Error bars, SEM.
Fig. 6.
Fig. 6.
Decreased abundance of p190RhoGAP promotes endothelial differentiation and morphogenesis into cellular networks. (A) Flow cytometric analysis of CD31+ scrKD, p190KD, and GATA2KD CDCs. (B) Immunoblotting analysis of GATA2 in scrKD and p190KD CDCs. Noncontiguous lanes from a single experiment are indicated by white lines. (C) RT-PCR analysis of GATA2 and TFII-1 mRNA in p190KD CDCs relative to scrKD CDCs cultured on MRS. (D) RT-PCR analysis of GATA2 mRNA in p190KD CDCs cultured on glass relative to scrKD cultured on glass (left bar) and in p190KD CDCs cultured on MRS relative to scrKD CDCs cultured on glass (right bar). (E) Flow cytometric analysis of CD31 in scrKD CDCs cultured for 10 days on glass or on MRS and in scrKD and p190KD cells cultured for 6 days on MRS followed by 4 days on glass (M6G). (F) p190KD cells form lacunae network on MRS within 10 days. (G) Quantification of lacunae density formed by p190KD and scrKD cells on MRS. n = 3 samples. (H and I) Cell organization after 10 days of culture of scrKD (H) and p190KD (I) CDCs on glass. Scale bars, 20 mm (F, H, and I). *P < 0.5; **P < 0.01; ***P < 0.001. Error bars, SEM.
Fig. 7.
Fig. 7.
p190RhoGAP regulates MRS-induced CDC proliferation and endothelial differentiation. (A to D)Computational model and experimental analysis of CDC proliferation and differentiation. Representative simulation results showing effects of enhanced proliferation and differentiation (see also fig. S7), with increased proliferation rates for c-kit /CD31 and c-kit+/CD31+ cells (A), increased differentiation rates for c-kit+/CD31 and c-kit+/CD31+ cells (B), and increased rates for both proliferation and differentiation (C). Time course flow cytometry analysis of p190KD CDCs (vertical bars) (D). Overlaid solid lines show predictions of computational model calculated in (C). (E) Flow cytometric analysis of CD31 abundance of CDCs transduced with empty SV40 plasmid (EV, black), p190RhoGAP overexpression vector (p190++, blue), p190KD CDCs (green), p190++CDCs rescued with p190RhoGAP shRNA (p190++ and p190KD, red), and human umbilical cord endothelial cells (HUVEC) (cyan). (F) Quantification of percentage of CD31+ cells in (E). (G) Flow cytometric analysis of DiI-labeled CDC-lv-NCX-GFP cells transduced with empty SV40 expression vector (EV), p190RhoGAP overexpression vector (p190++), and p190RhoGAP shRNA (p190KD) in coculture with NRVMs for 10 days on MRS (n = 2 samples). Gates were created with negative control samples for DiI and wild-type CDCs. In all panels: *P < 0.05; **P < 0.01. Error bars, SEM.
Fig. 8.
Fig. 8.
p190RhoGAP regulates MRS-induced CDC proliferation in a RhoA-dependent manner. (A) Flow cytometric analysis of CD31 in cells cultured on MRS without (left) and with CN01 treatment (right). n = 2 samples. (B) Time-resolved WST-8–based cell proliferation analysis of wild-type cells cultured on glass and MRS without or with CN01, and p190KD or scrKD control cells cultured on MRS. Rightmost bars correspond to p190KD treated with a RhoA inhibitor, CT04, during culture on MRS. (C) Flow cytometric analysis of c-kit+ cells cultured for 7 days on glass, or MRS with CN01, or CT04 treatment throughout experiment, or CT04 treatment after 6 days of culture. (D)GATA2 abundance in scrKD or p190KD CDCs cultured on the indicated substrata, with the indicated treatments, and for the indicated time periods. Noncontiguous lanes from a single experiment are indicated by black lines. Data are representative of 2 experiments. *P < 0.05; **P < 0.01; ***P < 0.001. Error bars, SEM.
Fig. 9.
Fig. 9.
p190RhoGAP regulates substratum rigidity–induced endothelial differentiation through a RhoA-independent mechanism. (A to D) In scrKD cells cultured on MRS for 3 days (A) and 10 days. (B), GATA2 changes from a mostly perinuclear localization to a mostly nuclear localization (arrows). In p190KD cells cultured on MRS for 3 days (C) and 10 days (D), GATA changes from a nuclear and cytoplasmic localization to a predominantly nuclear localization by day 10 (arrows). (E) Analysis of perinuclear, and nuclear GATA2 localization in wild-type CDCs and p190KD CDCs cultured on glass and MRS for 3, 7, and 10 days. (F) Schematic showing the putative role of the rigidity-induced decrease in p190RhoGAP abundance in promoting cell proliferation, endothelial differentiation, and morphogenesis through regulation of RhoA activation and abundance and subcellular localization of GATA2. Scale bars, 20 μm (A to D). *P < 0.05; **P < 0.01. Error bars, SEM.
Fig. 10.
Fig. 10.
Substratum rigidity coordinates progenitor cell proliferation, endothelial differentiation, and lacunae morphogenesis through co-regulation of various signaling modules by p190RhoGAP. (A) Schematic representing the time course of abundance dynamics of various key players identified in mechanotransduction pathway involved in rigidity-mediated endothelial differentiation of CDCs. Vertical lines represent day 0 (when cells are seeded), day 6 (when spheroids form and mature), day 7 (when spheroids start dispersing), and day 14 (when cellular networks are formed). (B) Schematic summary of the proposed mechanism of substratum rigidity–induced phenotypic changes regulated by p190RhoGAP abundance. Decreased p190RhoGAP abundance increases RhoA activity, leading to enhanced proliferation of c-kit+ stem cells and morphogenetic changes through ROCK and MLC. p190RhoGAP silencing increases abundance and plasma membrane localization of p120-catenin, thereby enhancing cell-cell contact formation. p120-catenin abundance decreases during spheroid dispersal. Decreased p190RhoGAP abundance also increases the amounts of TFII-1 and GATA2 and localization of GATA2 to the nucleus, resulting in endothelial differentiation, and control of collective cell morphology. Substratum rigidity also controls YAP localization and abundance, with a transient rise during cell aggregation and a subsequent reduction during the ensuing increase in GATA2 abundance. GATA2 promotes the increased abundance of CD31 and VEGFR, events that accompany endothelial differentiation.

References

    1. Guo WH, Frey MT, Burnham NA, Wang YL, Substrate rigidity regulates the formation and maintenance of tissues. Biophys. J. 90, 2213–2220 (2006). - PMC - PubMed
    1. Vogel V, Sheetz M, Local force and geometry sensing regulate cell functions. Nat. Rev. Mol. Cell Biol. 7, 265–275 (2006). - PubMed
    1. Montell DJ, Morphogenetic cell movements: Diversity from modular mechanical properties. Science 322, 1502–1505 (2008). - PubMed
    1. Kim DH, Lipke EA, Kim P, Cheong R, Thompson S, Delannoy M, Suh KY, Tung L, Levchenko A, Nanoscale cues regulate the structure and function of macroscopic cardiac tissue constructs. Proc. Natl. Acad. Sci. U.S.A. 107, 565–570 (2010). - PMC - PubMed
    1. Mammoto A, Connor KM, Mammoto T, Yung CW, Huh D, Aderman CM, Mostoslavsky G, Smith LE, Ingber DE, A mechanosensitive transcriptional mechanism that controls angiogenesis. Nature 457, 1103–1108 (2009). - PMC - PubMed

Publication types

LinkOut - more resources