. 2012 Aug;14(8):1050-61.
doi: 10.1093/neuonc/nos126. Epub 2012 Jun 4.

Longitudinal evaluation of MPIO-labeled stem cell biodistribution in glioblastoma using high resolution and contrast-enhanced MR imaging at 14.1 tesla

Affiliations

Longitudinal evaluation of MPIO-labeled stem cell biodistribution in glioblastoma using high resolution and contrast-enhanced MR imaging at 14.1 tesla

Myriam M Chaumeil et al. Neuro Oncol. 2012 Aug.

Abstract

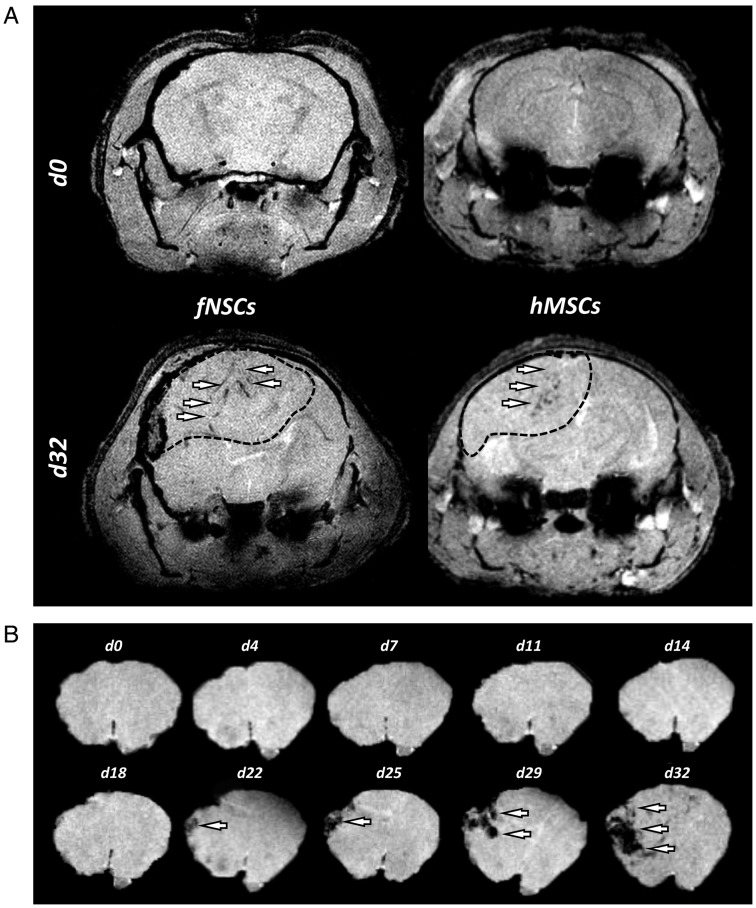
To optimize the development of stem cell (SC)-based therapies for the treatment of glioblastoma (GBM), we compared the pathotropism of 2 SC sources, human mesenchymal stem cells (hMSCs) and fetal neural stem cells (fNSCs), toward 2 orthotopic GBM models, circumscribed U87vIII and highly infiltrative GBM26. High resolution and contrast-enhanced (CE) magnetic resonance imaging (MRI) were performed at 14.1 Tesla to longitudinally monitor the in vivo location of hMSCs and fNSCs labeled with the same amount of micron-size particles of iron oxide (MPIO). To assess pathotropism, SCs were injected in the contralateral hemisphere of U87vIII tumor-bearing mice. Both MPIO-labeled SC types exhibited tropism to tumors, first localizing at the tumor edges, then in the tumor masses. MPIO-labeled hMSCs and fNSCs were also injected intratumorally in mice with U87vIII or GBM26 tumors to assess their biodistribution. Both SC types distributed throughout the tumor in both GBM models. Of interest, in the U87vIII model, areas of hyposignal colocalized first with the enhancing regions (ie, regions of high vascular permeability), consistent with SC tropism to vascular endothelial growth factor. In the GBM26 model, no rim of hyposignal was observed, consistent with the infiltrative nature of this tumor. Quantitative analysis of the index of dispersion confirmed that both MPIO-labeled SC types longitudinally distribute inside the tumor masses after intratumoral injection. Histological studies confirmed the MRI results. In summary, our results indicate that hMSCs and fNSCs exhibit similar properties regarding tumor tropism and intratumoral dissemination, highlighting the potential of these 2 SC sources as adequate candidates for SC-based therapies.


Figures

Fig. 1.
Fig. 1.
MPIO labeling of hMSCs and fNSCs. (A) Confocal fluorescence microscopy was performed on (1) MPIO-labeled hMSCs (60×), (2) unlabeled hMSCs, (3) a MPIO-labeled hMS cell (100×) and (4) MPIO-labeled fNSCs (60×). These results confirm the cytoplasmic localization of MPIO (green, Dragon green fluorescent tag) around the nuclei (blue, Hoescht staining) for both SC sources. (B) Level of fluorescence measured from a range of 9 concentrations of free MPIO in 200 μL of PBS (black, n = 4 per data point) and from 1 × 10⁶ MPIO-labeled fNSCs (red, n = 4) and 1 × 10⁶ MPIO-labeled hMSCs (blue, n = 4). Incubation times of 24 h for fNSCs and 6 h for hMSCs lead to a comparable level of fluorescence (P = .7).
Fig. 2.
Fig. 2.
Tropism of MPIO-labeled hMSCS and fNSCs toward U87vIII tumors following contralateral injections. Axial T2*-w MRI slices of U87vIII tumor-bearing mice on the day of (d0), 2 days (d2), and 7 days (d7) after contralateral injection of (A) MPIO-labeled hMSCs and (B) MPIO-labeled fNSCs. The MPIO-labeled SC injection sites are shown as empty circles, the tumor injection sites as filled circles. The dotted lines show the localization of the displayed imaging slices. MPIO-labeled SCs localized at the edges of the tumor (black arrows) and inside the tumor masses (white arrows).
Fig. 3.
Fig. 3.
Tropism of MPIO-labeled SCs toward areas of high permeability at the edge of and, inside U87vIII tumors following contralateral injections. (A) Axial T2*-w MRI slices of 1 U87vIII tumor-bearing mouse 7 days after contralateral injection of MPIO-labeled hMSCs and (B) corresponding CE-MR images, confirming the colocalization of MPIO-induced areas of hyposignal with the edges of the post-Gd enhancing tumors. The MPIO-labeled SC injection sites are shown as empty circles, the tumor injection sites as filled circles. The dotted lines show the localization of the displayed imaging slices. MPIO-labeled SCs localized at the edges of the tumors in areas of high permeability (black arrows) and inside the tumor masses (white arrows).
Fig. 4.
Fig. 4.
Biodistribution of MPIO-labeled hMSCS and fNSCs in U87vIII tumors following intratumoral injections. (A) Axial T2*-w MR images of U87vIII tumor bearing mice on the day of and (B) 7 days after intratumoral injection of MPIO-labeled fNSCS (left) and hMSCs (right). (C) Corresponding CE-MR images, confirming the colocalization of MPIO-induced areas of hyposignal with the edges of the post-Gd enhancing tumors. The MPIO-labeled SCs/tumor cells injection site is shown as a filled circle; the dotted line shows the localization of the displayed imaging slices. MPIO-labeled SCs localized at the edges of the tumor (black arrows) and inside the tumor masses (white arrows).
Fig. 5.
Fig. 5.
Biodistribution of MPIO-labeled hMSCS and fNSCs in GBM26 tumors following intratumoral injections. (A) Axial T2*-w MR images of GBM26 tumor-bearing mice on the day of (d0) and 32 days (d32) after intratumoral injection of MPIO-labeled hMSCS (left) and fNSCs (right). The dotted line shows the localization of the GBM26 tumor. (B) T2*-w axial images of a GBM26 tumor-bearing mice injected with MPIO-labeled hMSCs showing the brain region at days 0/4/7/11/14/18/22/25/29/32. MPIO-labeled SCs localized inside the tumor masses (white arrows).
Fig. 6.
Fig. 6.
Quantitative assessment of MPIO-labeled SCs biodistribution. Index of dispersion formula image as a percentage of formula image 
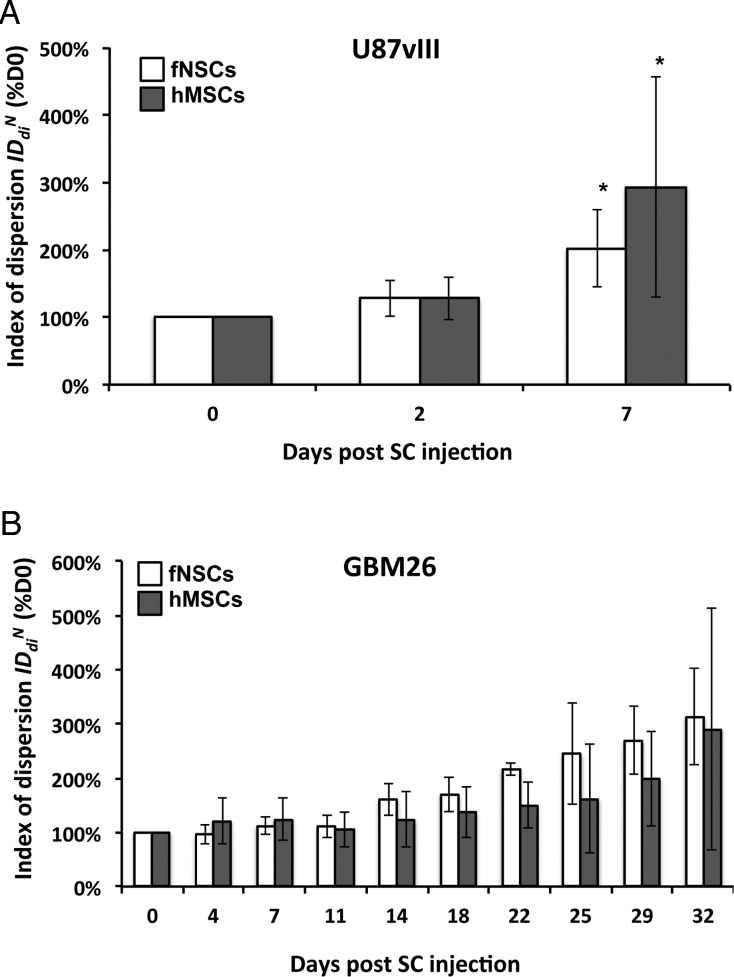
plotted for each imaging day post intratumoral injection of MPIO-labeled hMSCs (grey) and MPIO-labeled fNSCs (white) in (A) U87vIII and (B) GBM26 tumor-bearing mice. A significant increase of the index of dispersion formula image was observed for both SC sources between day 0 and day 7 for the U87vIII tumor type (*P < .05), and no significant differences were found between cell types. In the GBM26 model, an increase in formula image was also observed between day 0 and day 32 for both SC sources.
Fig. 7.
Fig. 7.
Immunohistochemical and immunofluorescence analysis (A) PB staining showing the presence of MPIO-labeled cells inside a U87vIII tumor mass 7 days after intratumoral injection (top row: hMSC; bottom row: fNSCs). (B) IF demonstrating the Dragon Green fluorescence of MPIO-labeled SCs (green; top row: hMSC; bottom row: fNSCs) in an U87vIII tumor expressing EGFRVIII (red; DAPI in blue). (C) T2*-w MR image and corresponding PB staining of a U87vIII tumor-bearing mouse injected with MPIO-labeled fNSCs in the contralateral hemisphere. (D) PB-positive MPIO-labeled hMSCs tracking an EGFRVIII-positive tumor microsatellite (E) CD68 staining showing a localization pattern different from the Dragon Green pattern.
Fig. 8.
Fig. 8.
Analysis of the spatial distribution of MPIO-labeled SCs post-intratumoral injection in U87vIII tumors. The histogram presents the number of PB-positive cells in each of the 4 brain regions (injection site, intratumoral, peritumoral, and brain tissue adjacent to tumor [BAT]). No statistically significant differences in the number of PB cells could be found between the 2 SC types (P = .7, n = 3 per group).

References

    1. CBRTUS. Statistical report - Primary brain and central nervous system tumors diagnosed in the United states in 2004–2006. 2010. http://seer.cancer.gov/ - PMC - PubMed
    1. Louis DN, Ohgaki H, Wiestler OD, et al. The 2007 WHO classification of tumours of the central nervous system. Acta Neuropathol. 2007;114(2):97–109. doi:10.1007/s00401-007-0243-4. - DOI - PMC - PubMed
    1. Clarke J, Butowski N, Chang S. Recent advances in therapy for glioblastoma. Arch Neurol. 2010;67(3):279–283. doi:10.1001/archneurol.2010.5. - DOI - PubMed
    1. Stupp R, Hegi ME, Mason WP, et al. Effects of radiotherapy with concomitant and adjuvant temozolomide versus radiotherapy alone on survival in glioblastoma in a randomised phase III study: 5-year analysis of the EORTC-NCIC trial. Lancet Oncol. 2009;10(5):459–466. doi:10.1016/S1470-2045(09)70025-7. - DOI - PubMed
    1. Stupp R, Mason WP, van den Bent MJ, et al. Radiotherapy plus concomitant and adjuvant temozolomide for glioblastoma. N Engl J Med. 2005;352(10):987–996. doi:10.1056/NEJMoa043330. - DOI - PubMed

Publication types