

Comparative Genetic Mapping and Discovery of Linkage Disequilibrium Across Linkage Groups in White Clover (Trifolium repens L.)
- PMID: 22670230
- PMCID: PMC3362943
- DOI: 10.1534/g3.112.002600
Comparative Genetic Mapping and Discovery of Linkage Disequilibrium Across Linkage Groups in White Clover (Trifolium repens L.)
Abstract
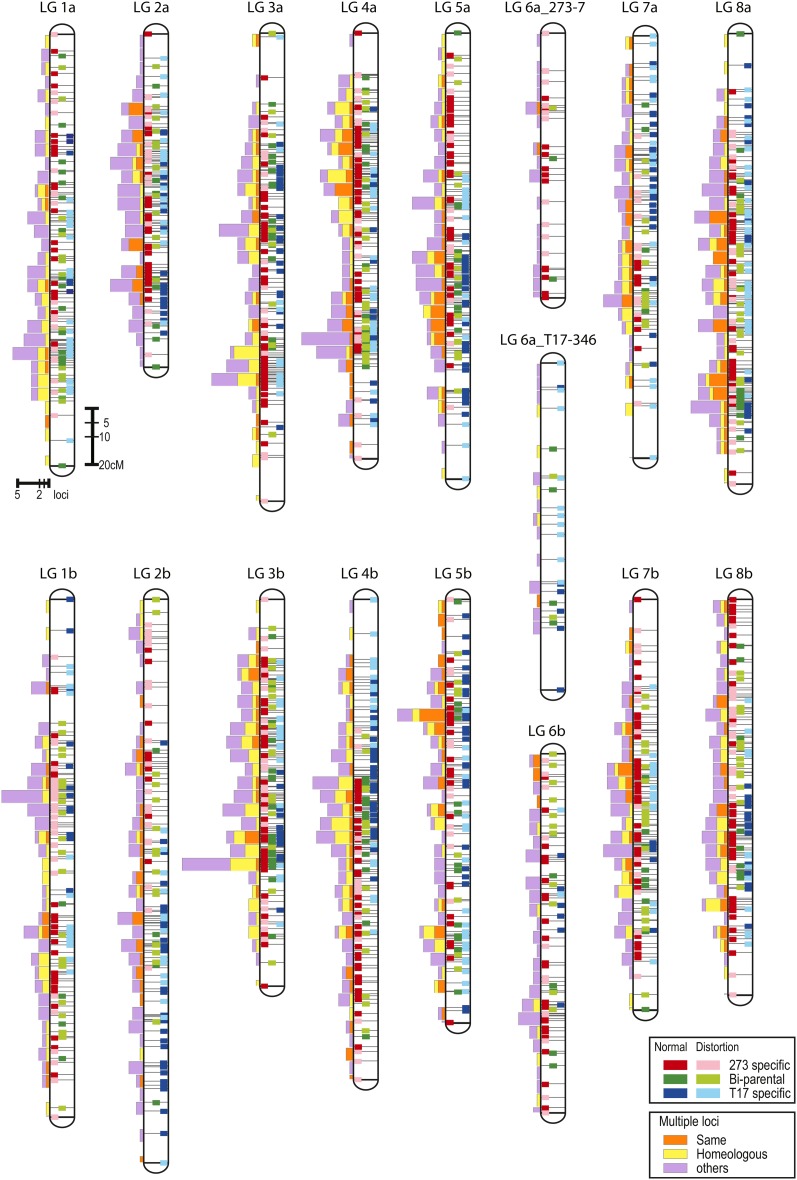
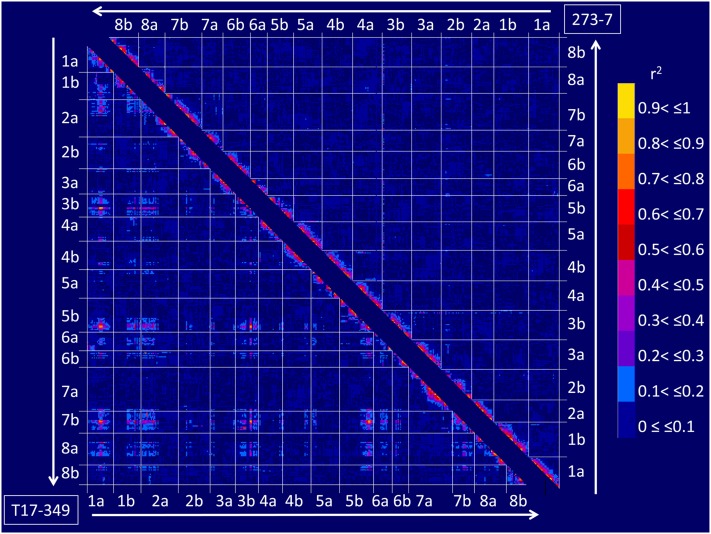
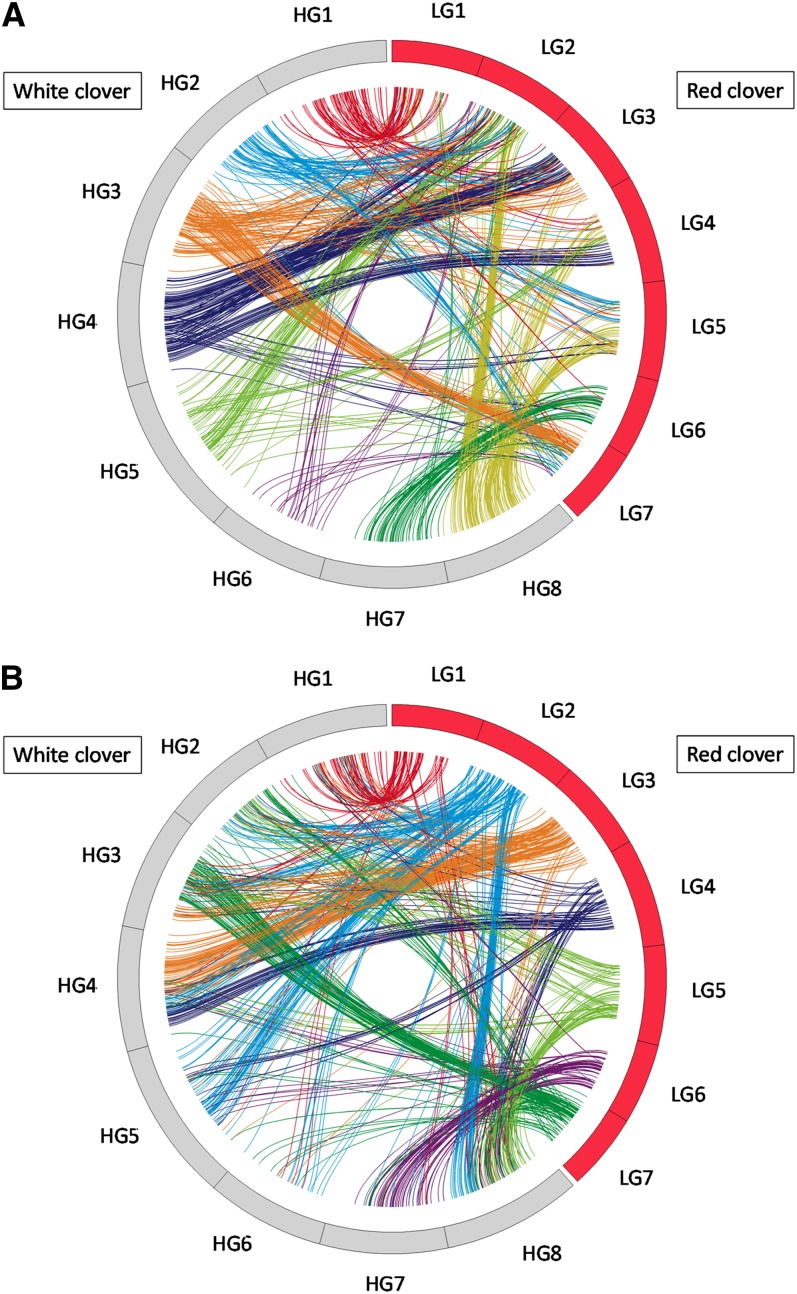
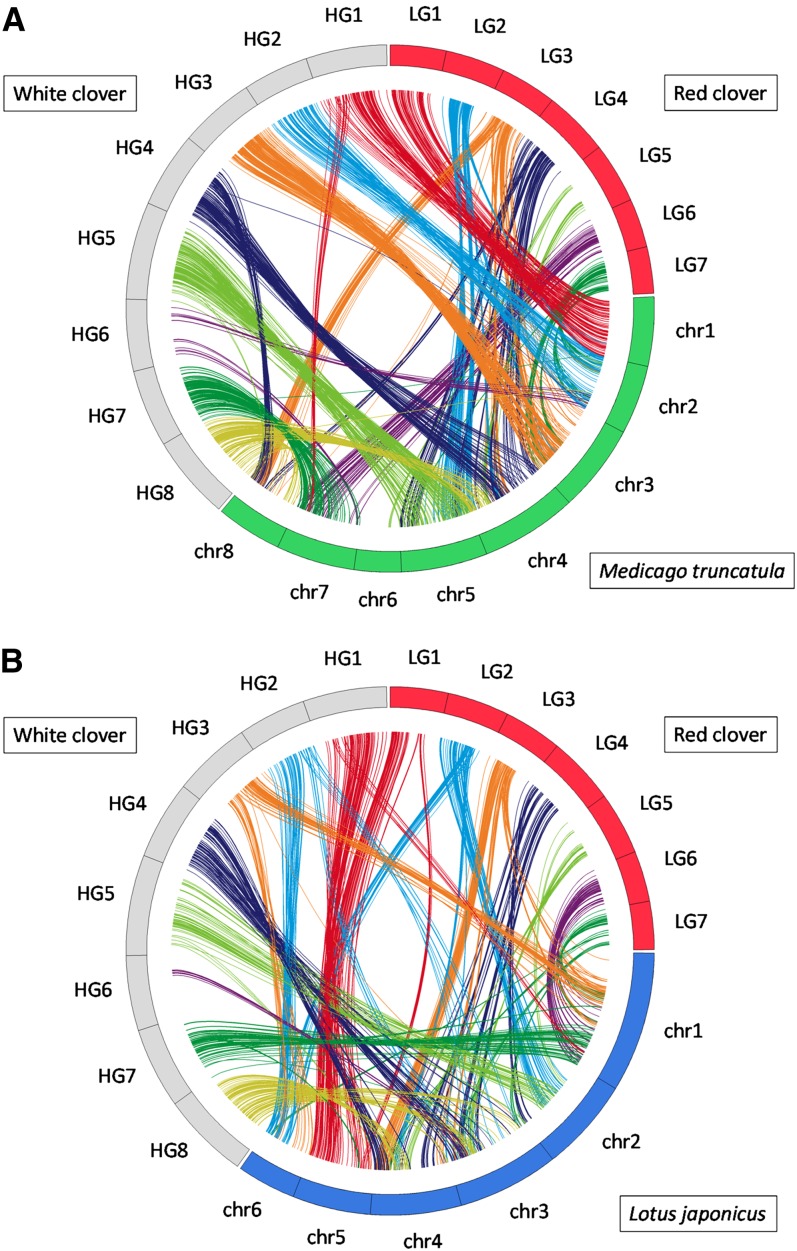
White clover (Trifolium repens L.) is an allotetraploid species (2n = 4X = 32) that is widely distributed in temperate regions and cultivated as a forage legume. In this study, we developed expressed sequence tag (EST)-derived simple sequence repeat (SSR) markers, constructed linkage maps, and performed comparative mapping with other legume species. A total of 7982 ESTs that could be assembled into 5400 contigs and 2582 singletons were generated. Using the EST sequences that were obtained, 1973 primer pairs to amplify EST-derived SSR markers were designed and used for linkage analysis of 188 F(1) progenies, which were generated by a cross between two Japanese plants, '273-7' and 'T17-349,' with previously published SSR markers. An integrated linkage map was constructed by combining parental-specific maps, which consisted of 1743 SSR loci on 16 homeologous linkage groups with a total length of 2511 cM. The primer sequences of the developed EST-SSR markers and their map positions are available on http://clovergarden.jp/. Linkage disequilibrium (LD) was observed on 9 of 16 linkage groups of a parental-specific map. The genome structures were compared among white clover, red clover (T. pratense L.), Medicago truncatula, and Lotus japonicus. Macrosynteny was observed across the four legume species. Surprisingly, the comparative genome structure between white clover and M. truncatula had a higher degree of conservation than that of the two clover species.
Keywords: comparative map; expressed sequence tag–simple sequence repeat; linkage disequilibrium; white clover.
Figures
References
-
- Arabidopsis Genome Initiative, 2000. Analysis of the genome sequence of the flowering plant Arabidopsis thaliana. Nature 408: 796–815 - PubMed
-
- Asamizu E., Nakamura Y., Sato S., Fukuzawa H., Tabata S., 1999. A large scale structural analysis of cDNA in a unicellular green alga Chlamydomonas reinhardtii. I. Generation of 3433 non-redundant expressed sequence tags. DNA Res. 31: 369–373 - PubMed
-
- Atwood S. S., Hill H. D., 1940. The regularity of meiosis in microsporocytes of Trifolium repens. Am. J. Bot. 27: 730–735
-
- Baker M. J., Williams W. M., 1987. White Clover. CABI Publishing, Wallingford, UK
-
- Barrett B., Griffiths A., Schreiber M., Ellison N., Mercer C., et al. , 2004. A microsatellite map of white clover. Theor. Appl. Genet. 109: 596–608 - PubMed
LinkOut - more resources
Full Text Sources
Research Materials