. 2012 Jun 6:13:220.
doi: 10.1186/1471-2164-13-220.

Widespread uncoupling between transcriptome and translatome variations after a stimulus in mammalian cells

Affiliations

Widespread uncoupling between transcriptome and translatome variations after a stimulus in mammalian cells

Toma Tebaldi et al. BMC Genomics. .

Abstract

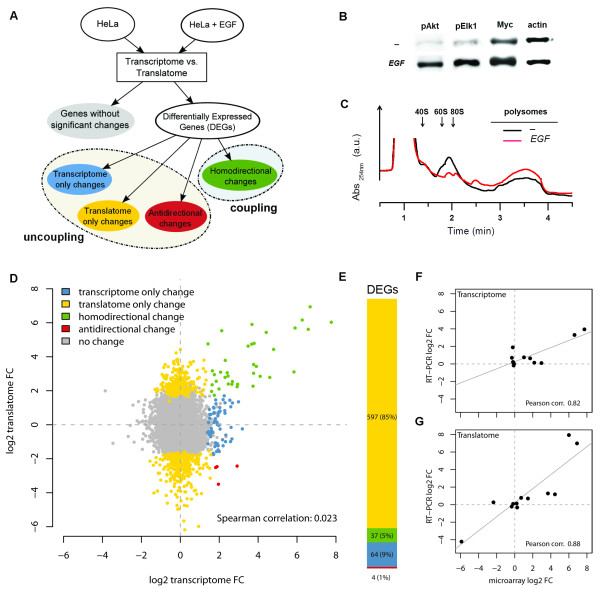
Background: The classical view on eukaryotic gene expression proposes the scheme of a forward flow for which fluctuations in mRNA levels upon a stimulus contribute to determine variations in mRNA availability for translation. Here we address this issue by simultaneously profiling with microarrays the total mRNAs (the transcriptome) and the polysome-associated mRNAs (the translatome) after EGF treatment of human cells, and extending the analysis to other 19 different transcriptome/translatome comparisons in mammalian cells following different stimuli or undergoing cell programs.

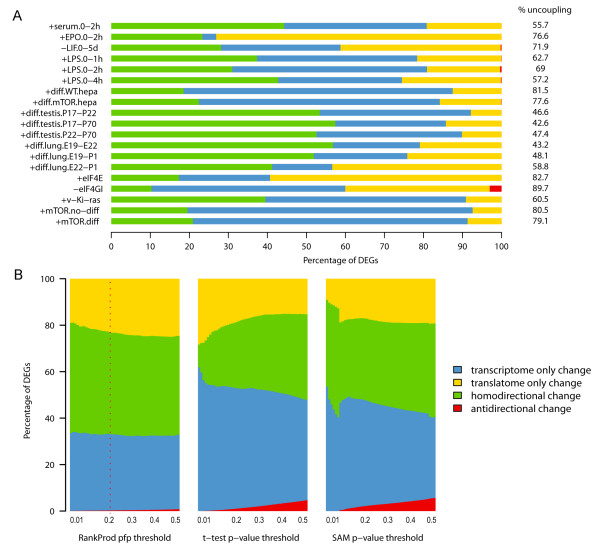
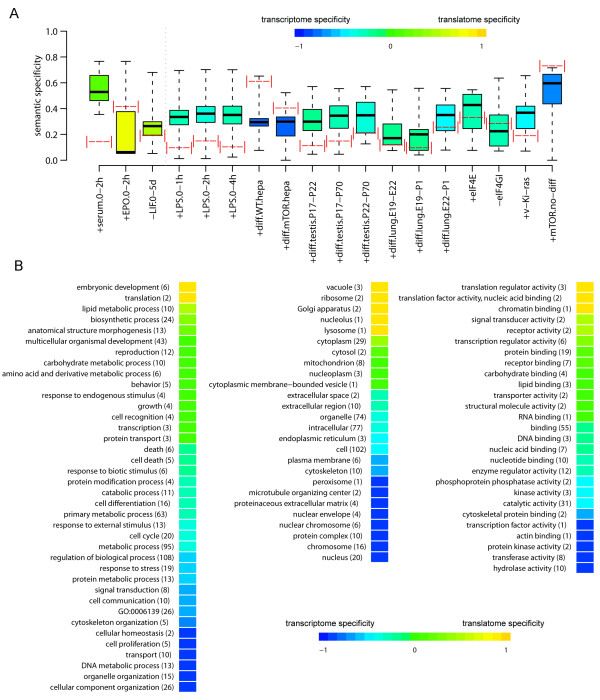
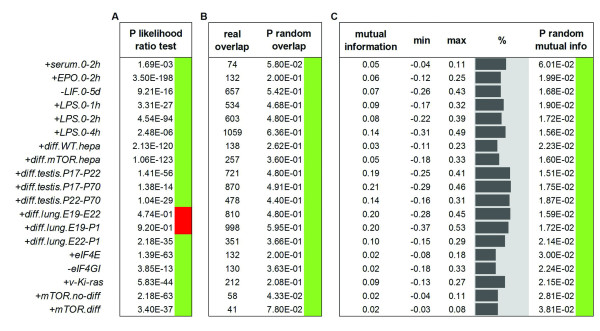
Results: Triggering of the EGF pathway results in an early induction of transcriptome and translatome changes, but 90% of the significant variation is limited to the translatome and the degree of concordant changes is less than 5%. The survey of other 19 different transcriptome/translatome comparisons shows that extensive uncoupling is a general rule, in terms of both RNA movements and inferred cell activities, with a strong tendency of translation-related genes to be controlled purely at the translational level. By different statistical approaches, we finally provide evidence of the lack of dependence between changes at the transcriptome and translatome levels.

Conclusions: We propose a model of diffused independency between variation in transcript abundances and variation in their engagement on polysomes, which implies the existence of specific mechanisms to couple these two ways of regulating gene expression.


Figures

Figure 1
Figure 1
EGF treatment of HeLa cells induces extensive uncoupling between transcriptome and translatome gene expression variations. (A) Flowchart of differential expression analysis between transcriptome and translatome after EGF treatment and definition of uncoupling. Uncoupling qualifies genes classified as DEGs (differentially expressed genes) with significant variations only in the transcriptome (in cyan), only in the translatome (in yellow) and with opposite significant variations between transcriptome and translatome (in red). Coupling qualifies genes classified as differentially expressed (DEGs) by both transcriptome and translatome profile comparisons and with homodirectional changes (in green). (B) Western blots indicating the activation of the EGFR signaling pathway by the increase of known EGFR mediators and targets: phosphorylated Akt1, phosphorylated Elk1 and Myc. (C) Comparison between sucrose gradient profiles of HeLa cells without EGF (in black) and with EGF (in red). (D) Scatterplot of transcriptome and translatome log2 transformed fold changes, showing genes belonging to the coupling and uncoupling categories as defined in panel A. Spearman correlation between fold changes is also shown. (E) Barplot highlighting the uncoupling value between translatome and transcriptome DEGs. The number of DEGs and the corresponding percentages are displayed following the same colour scheme adopted in the rest of the figure (F-G) Scatterplot showing correlation between transcriptome (F) and translatome (G) log2 transformed fold changes derived from microarray hybridizations and quantitative RT-PCR on a set of twelve genes, displayed as black dots. Regression lines are drawn in grey.
Figure 2
Figure 2
Widespread gene expression uncoupling is a general and recurring phenomenon in all transcriptome-translatome profiling datasets. (A) Barplot displaying the degree of uncoupling between transcriptome and translatome DEGs for each dataset. Collected datasets are labelled by short names as explained in Table 1. Bar lengths show the relative proportion of DEGs in the four classes defined in Table 1. The corresponding percentages of uncoupled DEGs are shown on the right. (B) Uncoupling estimate is independent from the significance threshold and the algorithm used for calling DEGs. Percentage of DEGs detected by the comparison (homodirectional change in green, antidirectional change in red) between both transcriptome and translatome profiles, DEGs detected by the transcriptome comparison only (in cyan) and DEGs detected by the translatome comparison only (in yellow) were computed over all the datasets described in Table 1. Three algorithms are shown: RankProd, t-test and SAM. Inside each barplot the significance thresholds ranges from 0.01 to 0.5. In the barplot generated with RankProd the red vertical dashed line indicates the 0.2 significance threshold used to detect DEGs throughout the analysis. For t-test and SAM a Benjamini-Hochberg multiple test correction was applied to the resulting p-values.
Figure 3
Figure 3
Uncoupling between transcriptome and translatome is conserved in the enriched biological themes. (A) Summary of semantic specificity estimates (based on the optimized quantification of semantic specificity described in SI Materials and Methods). Red dotted lines represent semantic specificity estimates relative to the transcriptome and translatome comparisons within all datasets. Box and whisker plots show the reference distributions of semantic specificities (whiskers indicating minimal and maximal distribution values), characteristic of each dataset and reflecting semantic specificity estimates between the transcriptomes of unrelated dataset pairs. A semantic specificity falling within or below the reference distribution is indicative of very poor semantic similarity between the transcriptome and the translatome in a dataset pair. The color associated to the box of each dataset pair corresponds to the normalized difference between the number of GO terms over-represented only at the translatome level and the number of GO terms over-represented only at the transcriptome level, a quantity ranging from −1 (all the terms are enriched only at the transcriptome level, in blue) to 1 (all the terms are enriched only at the translatome level, in yellow). This measure is positive for the first three datasets on the left and negative for all the others (divided by a vertical dashed line in the figure). Having no overrepresented ontological terms, the dataset + mTOR.diff is not displayed. (B) For each GO term the transcriptome and translatome specificity degrees are calculated as the ratio between the number of datasets in which the term is transcriptome or translatome specific and the number of datasets in which the term is overrepresented. Terms are grouped into the broader GOslim categories and the median specificity values are calculated. The number of GO terms grouped in each GOslim category is specified in round brackets. Within each of the three GO domains (from left to right: Biological Process, Cellular Component and Molecular Function), categories are sorted from the most translatome-specific (in yellow) to the most transcriptome-specific (in blue).
Figure 4
Figure 4
Gene expression uncoupling is consistent with a hypothesis of lack of dependence between transcriptome and translatome variations. Results in agreement with the lack of dependence hypothesis are labeled with a green square, while results rejecting the lack of dependence hypothesis are labeled with a red square. (A) Likelihood Ratio p-values, testing the hypothesis that the numbers of DEGs in the transcriptome and the translatome are different, result significant for 17 of 19 datasets (P < 0.01). (B) The overlap observed between transcriptome and translatome DEGs is never significantly higher than its random estimate (random overlap P > 0.01 in 19 out of 19 datasets). (C) Mutual information observed between transcriptome and translatome is never significantly higher than its random estimate (random mutual information P > 0.01 in 19 out of 19 datasets). Theoretical mutual information minima and maxima are also calculated for each dataset as explained in Methods. The positions of the real mutual information values inside the range defined by the theoretical minima and maxima are visualized as grey histograms.

References

    1. Terman SA. Relative effect of transcription-level and translation-level control of protein synthesis during early development of the sea urchin. Proc Natl Acad Sci USA. 1970;65:985–992. doi: 10.1073/pnas.65.4.985. - DOI - PMC - PubMed
    1. Gurdon JB, Lane CD, Woodland HR, Marbaix G. Use of frog eggs and oocytes for the study of messenger RNA and its translation in living cells. Nature. 1971;233:177–182. doi: 10.1038/233177a0. - DOI - PubMed
    1. Groppo R, Richter JD. Translational control from head to tail. Curr Opin Cell Biol. 2009;21:444–451. doi: 10.1016/j.ceb.2009.01.011. - DOI - PMC - PubMed
    1. Jackson RJ, Hellen CU, Pestova TV. The mechanism of eukaryotic translation initiation and principles of its regulation. Nat Rev Mol Cell Biol. 2010;11:113–127. doi: 10.1038/nrm2838. - DOI - PMC - PubMed
    1. Djuranovic S, Nahvi A, Green R. A Parsimonious Model for Gene Regulation by miRNAs. Science. 2011;331:550–553. doi: 10.1126/science.1191138. - DOI - PMC - PubMed