. 2012 Jun 6:13:222.
doi: 10.1186/1471-2164-13-222.

A high-resolution map of the Nile tilapia genome: a resource for studying cichlids and other percomorphs

Affiliations

A high-resolution map of the Nile tilapia genome: a resource for studying cichlids and other percomorphs

Richard Guyon et al. BMC Genomics. .

Abstract

Background: The Nile tilapia (Oreochromis niloticus) is the second most farmed fish species worldwide. It is also an important model for studies of fish physiology, particularly because of its broad tolerance to an array of environments. It is a good model to study evolutionary mechanisms in vertebrates, because of its close relationship to haplochromine cichlids, which have undergone rapid speciation in East Africa. The existing genomic resources for Nile tilapia include a genetic map, BAC end sequences and ESTs, but comparative genome analysis and maps of quantitative trait loci (QTL) are still limited.

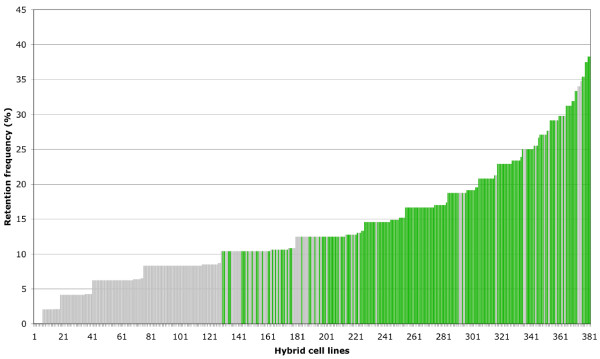
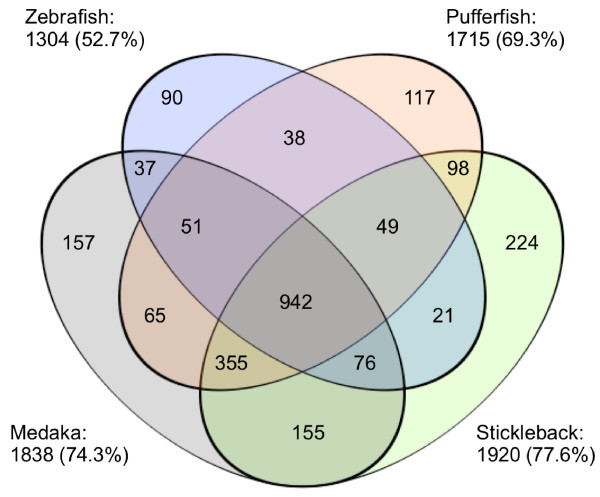
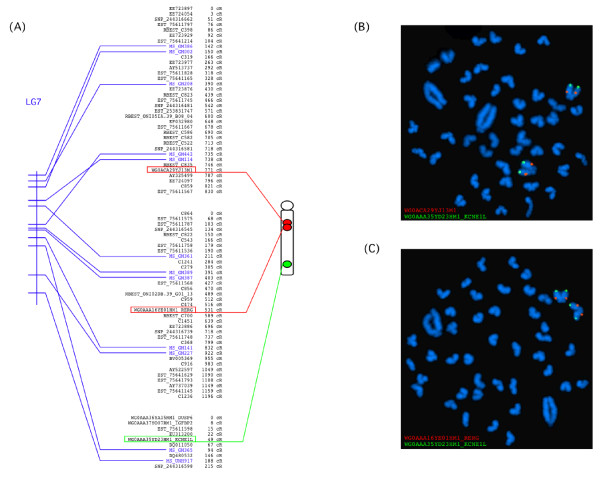
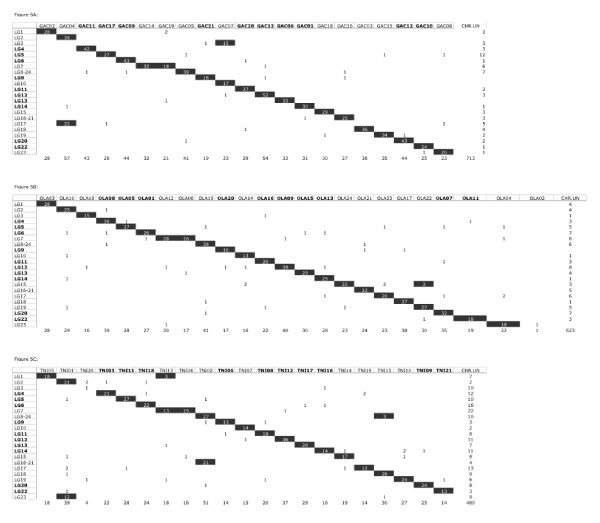
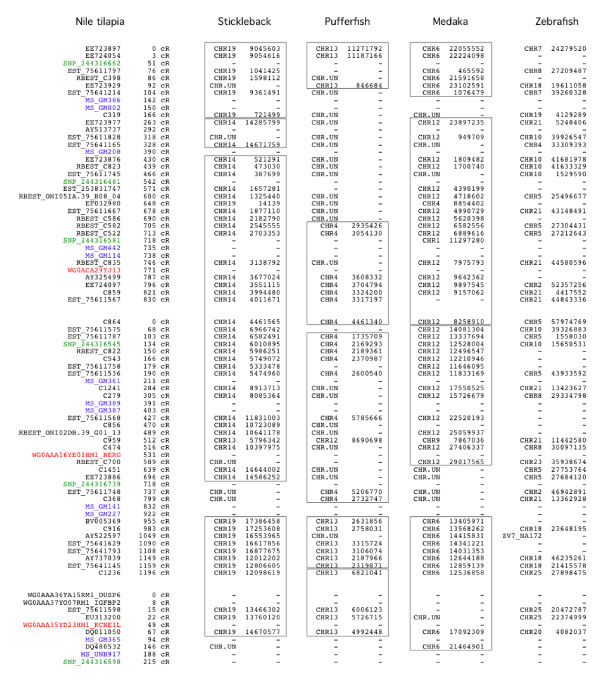
Results: We have constructed a high-resolution radiation hybrid (RH) panel for the Nile tilapia and genotyped 1358 markers consisting of 850 genes, 82 markers corresponding to BAC end sequences, 154 microsatellites and 272 single nucleotide polymorphisms (SNPs). From these, 1296 markers could be associated in 81 RH groups, while 62 were not linked. The total size of the RH map is 34,084 cR(3500) and 937,310 kb. It covers 88% of the entire genome with an estimated inter-marker distance of 742 Kb. Mapping of microsatellites enabled integration to the genetic map. We have merged LG8 and LG24 into a single linkage group, and confirmed that LG16-LG21 are also merged. The orientation and association of RH groups to each chromosome and LG was confirmed by chromosomal in situ hybridizations (FISH) of 55 BACs. Fifty RH groups were localized on the 22 chromosomes while 31 remained small orphan groups. Synteny relationships were determined between Nile tilapia, stickleback, medaka and pufferfish.

Conclusion: The RH map and associated FISH map provide a valuable gene-ordered resource for gene mapping and QTL studies. All genetic linkage groups with their corresponding RH groups now have a corresponding chromosome which can be identified in the karyotype. Placement of conserved segments indicated that multiple inter-chromosomal rearrangements have occurred between Nile tilapia and the other model fishes. These maps represent a valuable resource for organizing the forthcoming genome sequence of Nile tilapia, and provide a foundation for evolutionary studies of East African cichlid fishes.


Figures

Figure 1
Figure 1
Retention frequency of the Nile tilapia hybrid cell lines. The hybrid cell lines are numbered from 1 to 381 on the X axis. Presence/absence of 48 microsatellite markers spread all over the tilapia genome [15] was estimated by PCR determination. Their retention frequency per clone is presented on the Y axis. The 190 hybrid cell lines selected on quantitative and qualitative criteria that constitutes the tilapia RH panel are in green.
Figure 2
Figure 2
Venn diagram representing the distribution of markers shared by Nile tilapia and stickleback/medaka/pufferfish/zebrafish. Each model species is represented by an ellipse. Number of markers shared by two species or more are indicated in every intersection. For each model species, the number of markers and the percentage of the 2475 Nile tilapia markers are indicated.
Figure 3
Figure 3
(A) Integrated genetic-RH-FISH map of the tilapia chromosome LG7. The RH map on the middle consists of three RH groups containing ordered markers whose coordinates are indicated in cR3500. Microsatellites (in blue) allowed the anchorage of the RH map to the genetic map [15] figured by a vertical bar on the left. Double-FISH of BAC clones highlighted by a red or green frame indicate the relative position of the RH groups on the chromosome symbolized on the right side. The chromosome is orientated with its centromere up. (B) Results of Double-FISH experiment of BAC clone WG0AAA35YD23HM1 revealed with FITC (green) and BAC clone WG0AAA16YE01HM1 revealed with Rhodamin (red) on a chromosome preparation. (C) Results of Double-FISH experiment of BAC clone WG0AAA35YD23HM1 revealed with FITC (green) and BAC clone WG0ACA29YJ13M1 revealed with Rhodamin (red) on a chromosome preparation.
Figure 4
Figure 4
Oxford grids between Nile tilapia and (A) stickleback, (B) medaka, (C) pufferfish. Chromosomes are named as follows : LG : Nile tilapia chromosomes; GAC : stickleback chromosomes; OLA : medaka chromosomes; TNI : pufferfish chromosomes. Conserved chromosomes or conserved segments are figured in black squares containing the number of orthologous markers that identify them. Other numbers in the grid indicate the number of singletons. Chromosomes showing no synteny breakage between the four species are bolded.
Figure 5
Figure 5
Comparative map of the Nile tilapia chromosome LG7. Column 1 corresponds to marker names. All markers are gene-based markers except (a) those with prefix “MS” which correspond to microsatellites (in blue) taken from Lee et al. (2005), (b) those with prefix “WG0” which are BAC end markers (in red) and (c) those with prefix “SNP” which correspond to SNP-based markers (in green). Column 2 corresponds to marker coordinates expressed in centiRays (cR3500). Following columns correspond to comparative data with, from left to right, stickleback, pufferfish, medaka, zebrafish. For every marker, chromosome numbers and coordinates of the putative orthologs in the genome sequences of the four model species are displayed. CSO between Nile tilapia and stickleback/medaka/pufferfish are figured in boxes.
Figure 6
Figure 6
Cartesian plots of radiation hybrid typing by the GoldenGate technology. (A) Dots located above a threshold of 0.30 on the y-axis corresponded to positive clones scored “1”, dots located under the threshold corresponded to negative clones scored “0”. Dots located close to the threshold were considered as ambiguous results scored “2” (grey dots). (B) According to the overall repartition of dots on the profile of typing the threshold was lowered to 0.20 on the x-axis.

Similar articles

Cited by

References

    1. FAO. The State of World Fisheries and Aquaculture. 2010. http://wwwfaoorg/docrep/013/i1820e/i1820e00htm.
    1. Randall DJ, Wood CM, Perry SF, Bergman H, Maloiy GM, Mommsen TP, Wright PA. Urea excretion as a strategy for survival in a fish living in a very alkaline environment. Nature. 1989;337(6203):165–166. - PubMed
    1. Tine M, de Lorgeril J, D’Cotta H, Pepey E, Bonhomme F, Baroiller JF, Durand JD. Transcriptional responses of the black-chinned tilapia Sarotherodon melanotheron to salinity extremes. Marine Genomics. 2008;1:37–46. - PubMed
    1. Baroiller JF, D'Cotta H, Bezault E, Wessels S, Hoerstgen-Schwark G. Tilapia sex determination: Where temperature and genetics meet. Comparative biochemistry and physiology. 2009;153(1):30–38. - PubMed
    1. Trewavas E. Tilapiine fishes of the genera Sarotherodon. Oreochromis and Danakilia, British Museum Natural History, London, UK; 1983.

Publication types

LinkOut - more resources