. 2012 Jun 6:12:94.
doi: 10.1186/1471-2180-12-94.

Association between the ABO blood group and the human intestinal microbiota composition

Affiliations

Association between the ABO blood group and the human intestinal microbiota composition

Harri Mäkivuokko et al. BMC Microbiol. .

Abstract

Background: The mucus layer covering the human intestinal epithelium forms a dynamic surface for host-microbial interactions. In addition to the environmental factors affecting the intestinal equilibrium, such as diet, it is well established that the microbiota composition is individually driven, but the host factors determining the composition have remained unresolved.

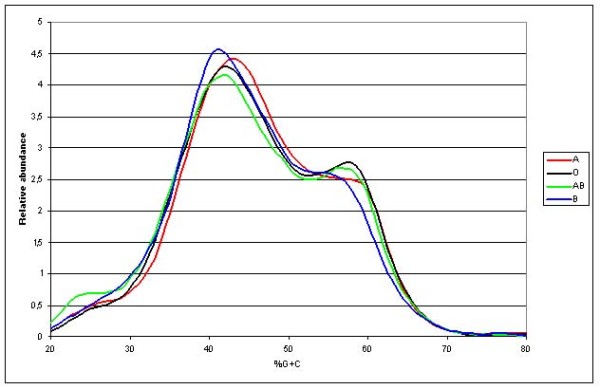
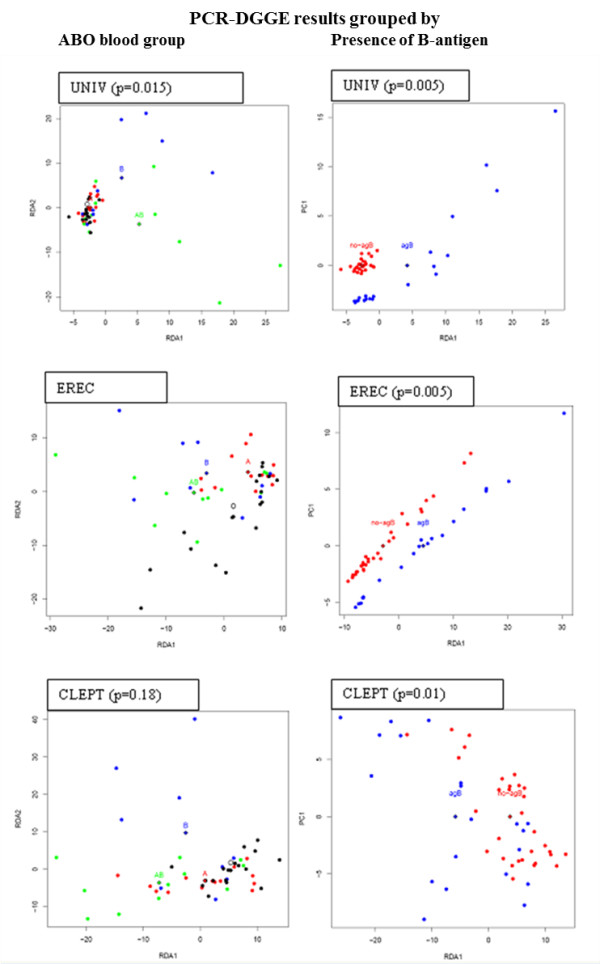
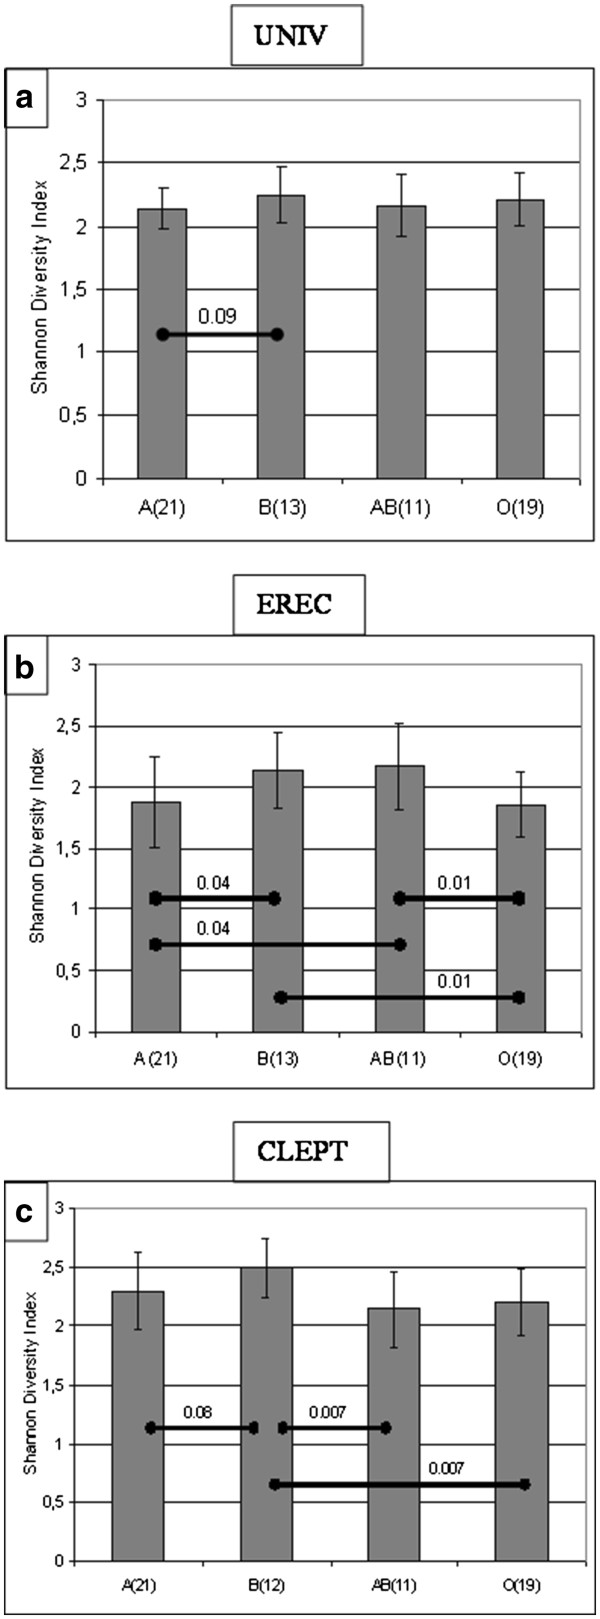
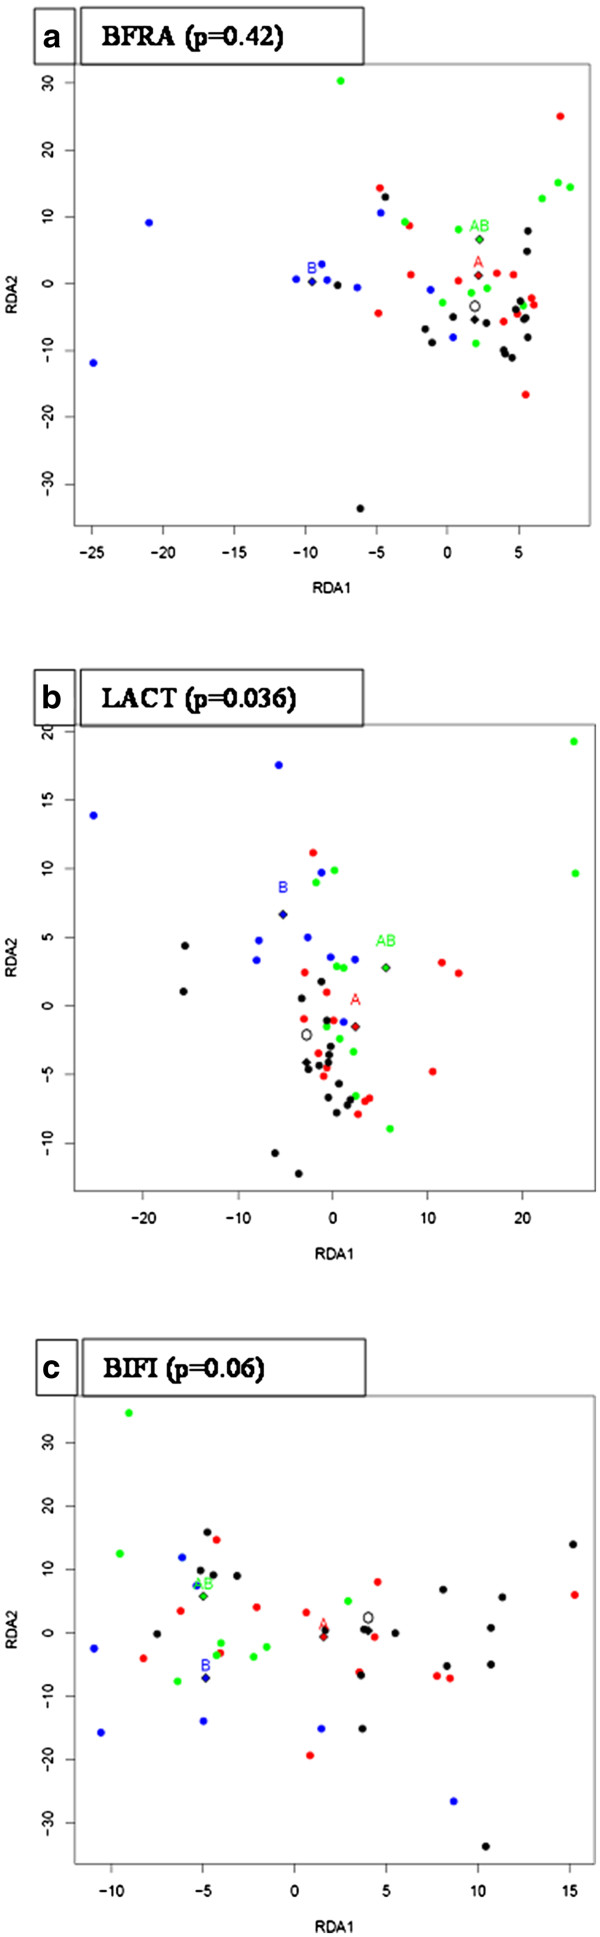
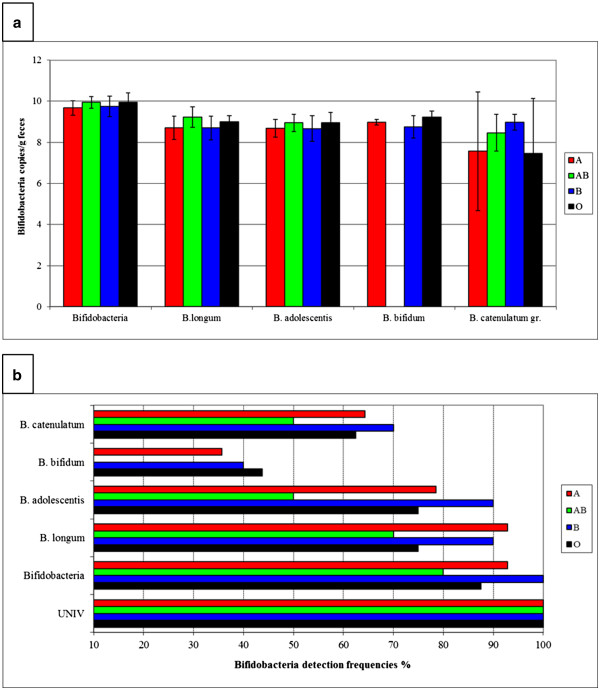
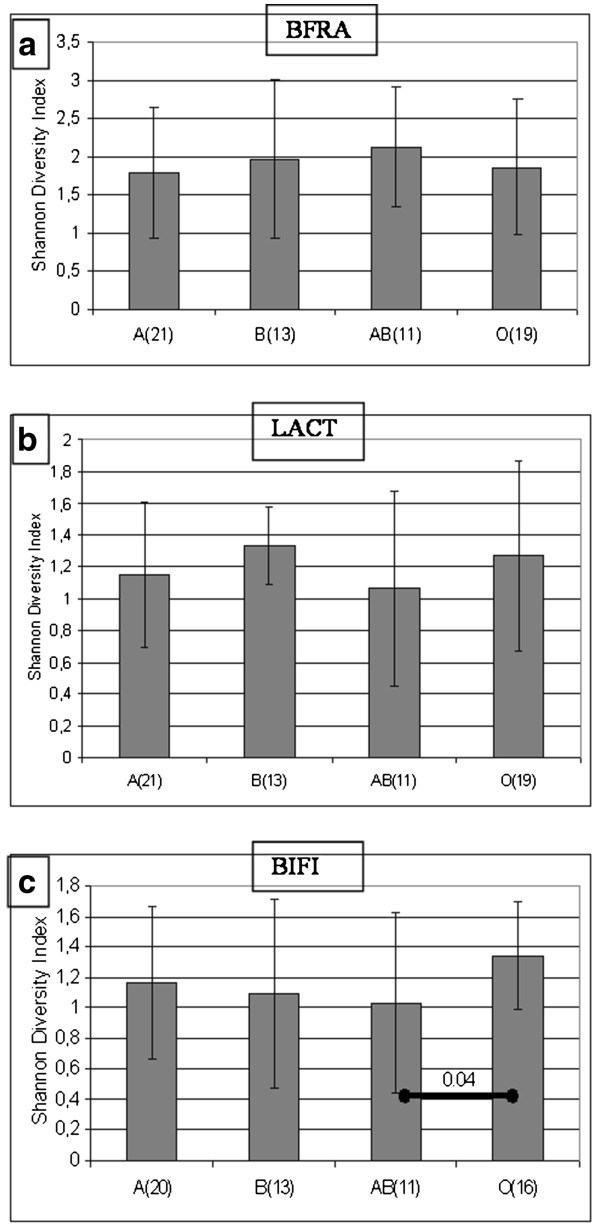
Results: In this study, we show that ABO blood group is involved in differences in relative proportion and overall profiles of intestinal microbiota. Specifically, the microbiota from the individuals harbouring the B antigen (secretor B and AB) differed from the non-B antigen groups and also showed higher diversity of the Eubacterium rectale-Clostridium coccoides (EREC) and Clostridium leptum (CLEPT) -groups in comparison with other blood groups.

Conclusions: Our novel finding indicates that the ABO blood group is one of the genetically determined host factors modulating the composition of the human intestinal microbiota, thus enabling new applications in the field of personalized nutrition and medicine.


Figures

Figure 1
Figure 1
%G + C-profile-data grouped by ABO blood groups. Averaged %G + C-profiles grouped by ABO blood groups revealing a difference in the overall microbial profile between ABO blood groups. Each line represents the average of %G + C-data points of individuals with different ABO blood groups. Line colours for each ABO group are as follows: A = red, B = blue, AB = green and O = black.
Figure 2
Figure 2
RDA-visualization of PCR-DGGE profile similarities. RDA visualization of microbiota profile similarities and ABO blood group types, revealing a clustering of the samples. Each dot represents a single individual and diamonds mark the calculated data centre points of the corresponding blood groups. P-value marks the statistical significance of the difference between blood group centres, computed with ANOVA-like permutation test from PCR-DGGE intensities grouped by ABO blood group (A) or by the presence of B-antigen (B). Dot colours for the ABO blood groups are as follows: A = red, B = blue, AB = green and O = black and for the B-antigen = blue and non-B antigen red, respectively. UNIV represent the PCR-DGGE obtained with the universal eubacterial primers (dominant bacteria), EREC with the Eubacterium rectaleClostridium coccoides primers and CLEPT with the Clostridium leptum primers. The RDA analysis shows clustering of samples according to ABO blood groups, especially according to the presence of the B antigen in the dominant and EREC group microbiota.
Figure 3
Figure 3
ABO blood group related differences in the microbiota diversity. The Shannon Diversity index calculations of the PCR-DGGE profiles obtained with a) universal eubacterial (UNIV) primers, b) Eubacterium rectaleClostridium coccoides (EREC) primers and c) Clostridium leptum (CLEPT) primers. Columns are averaged ± SD values of the corresponding ABO blood groups. Statistically significant differences BASED on ANOVA tests between ABO blood groups are marked with diagonal bars and with the corresponding p-value.
Figure 4
Figure 4
RDA visualization of microbiota profile similarities and ABO blood group types. Each dot represents a single individual, taking into account all individual intensities measured in each PCR-DGGE group. Diamonds mark the calculated data centre points of the corresponding blood groups. P-value marks the statistical significance of the differences between the blood groups from ANOVA-like permutation test. Dot colours for the ABO blood groups are as follows: A = red, B = blue, AB = green and O = black. a) PCR.-DGGE with Bacteroides fragilis (BFRA) primers, b) Lactobacillus (LACT) primers and c) Bifidobacterium (BIFI).
Figure 5
Figure 5
Abundance of bifidobacteria in ABO blood groups. a) Total bifidobacteria counts (copies/g faeces: average ± SD) by bifidobacteria species and genus specific qPCR-analysis. b) Detection frequencies (% of samples positive) of bifidobacteria as determined with the Bifidobacterium genus and species specific qPCR analysis.
Figure 6
Figure 6
ABO blood group related differences in the microbiota diversity. The Shannon Diversity index calculations of the PCR-DGGE profiles obtained with a)Bacteroides fragilis group (BFRA) primers, b)Lactobacillus (LACT) primers and c)Bifidobacterium (BIFI) primers. Columns are averaged ± SD values of the corresponding ABO blood groups.

References

    1. Eckburg PB, Bik EM, Bernstein CN, Purdom E, Dethlefsen L, Sargent M, Gill SR, Nelson KE, Relman DA. Diversity of the human intestinal microbial flora. Science. 2005;308(5728):1635–1638. doi: 10.1126/science.1110591. - DOI - PMC - PubMed
    1. Arumugam M, Raes J, Pelletier E, Le Paslier D, Yamada T, Mende DR, Fernandes GR, Tap J, Bruls T, Batto JM, Bertalan M, Borruel N, Casellas F, Fernandez L, Gautier L, Hansen T, Hattori M, Hayashi T, Kleerebezem M, Kurokawa K, Leclerc M, Levenez F, Manichanh C, Nielsen HB, Nielsen T, Pons N, Poulain J, Qin J, Sicheritz-Ponten T, Tims S, Torrents D, Ugarte E, Zoetendal EG, Wang J, Guarner F, Pedersen O, de Vos WM, Brunak S, Dore J, MetaHIT Consortium, Antolin M, Artiguenave F, Blottiere HM, Almeida M, Brechot C, Cara C, Chervaux C, Cultrone A, Delorme C, Denariaz G, Dervyn R, Foerstner KU, Friss C, van de Guchte M, Guedon E, Haimet F, Huber W, van Hylckama-Vlieg J, Jamet A, Juste C, Kaci G, Knol J, Lakhdari O, Layec S, Le Roux K, Maguin E, Merieux A, Melo Minardi R, M'rini C, Muller J, Oozeer R, Parkhill J, Renault P, Rescigno M, Sanchez N, Sunagawa S, Torrejon A, Turner K, Vandemeulebrouck G, Varela E, Winogradsky Y, Zeller G, Weissenbach J, Ehrlich SD, Bork P. Enterotypes of the human gut microbiome. Nature. 2011;473(7346):174–180. doi: 10.1038/nature09944. - DOI - PMC - PubMed
    1. Wu GD, Chen J, Hoffmann C, Bittinger K, Chen YY, Keilbaugh SA, Bewtra M, Knights D, Walters WA, Knight R, Sinha R, Gilroy E, Gupta K, Baldassano R, Nessel L, Li H, Bushman FD, Lewis JD. Linking Long-Term Dietary Patterns with Gut Microbial Enterotypes. Science. 2011;334(6052):105–108. doi: 10.1126/science.1208344. - DOI - PMC - PubMed
    1. Turnbaugh PJ, Hamady M, Yatsunenko T, Cantarel BL, Duncan A, Ley RE, Sogin ML, Jones WJ, Roe BA, Affourtit JP, Egholm M, Henrissat B, Heath AC, Knight R, Gordon JI. A core gut microbiome in obese and lean twins. Nature. 2009;457(7228):480–484. doi: 10.1038/nature07540. - DOI - PMC - PubMed
    1. Turnbaugh PJ, Ley RE, Hamady M, Fraser-Liggett CM, Knight R, Gordon JI. The human microbiome project. Nature. 2007;449(7164):804–810. doi: 10.1038/nature06244. - DOI - PMC - PubMed

Substances

LinkOut - more resources