. 2012 Sep;13(9):1198-205.
doi: 10.1111/j.1600-0854.2012.01385.x. Epub 2012 Jul 3.

Tuning multiple motor travel via single motor velocity

Affiliations

Tuning multiple motor travel via single motor velocity

Jing Xu et al. Traffic. 2012 Sep.

Abstract

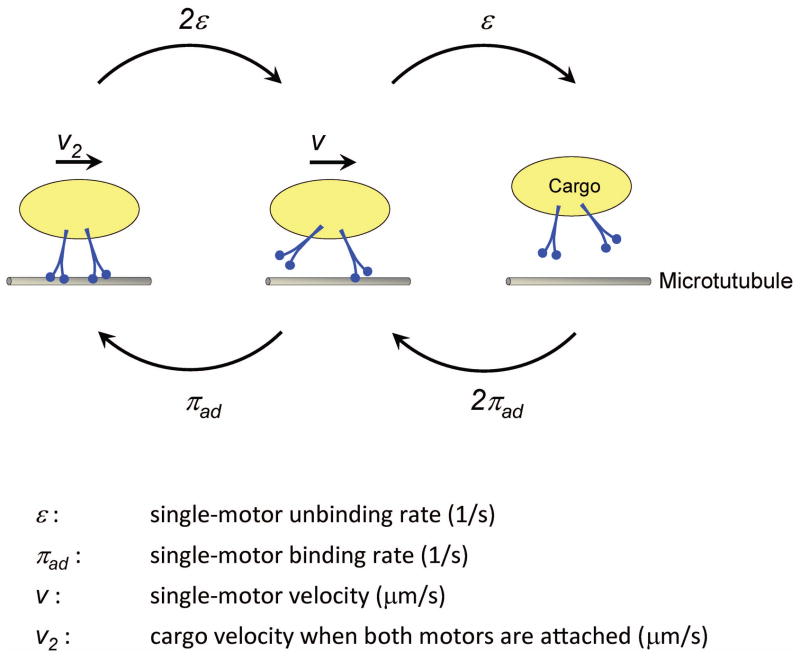
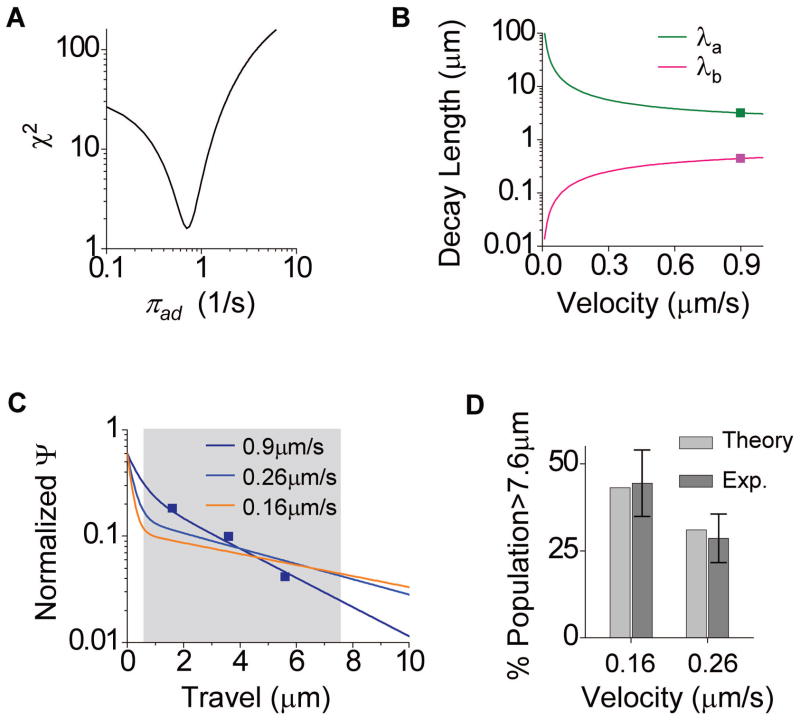
Microtubule-based molecular motors often work in small groups to transport cargos in cells. A key question in understanding transport (and its regulation in vivo) is to identify the sensitivity of multiple-motor-based motion to various single molecule properties. Whereas both single-motor travel distance and microtubule binding rate have been demonstrated to contribute to cargo travel, the role of single-motor velocity is yet to be explored. Here, we recast a previous theoretical study, and make explicit a potential contribution of velocity to cargo travel. We test this possibility experimentally, and demonstrate a strong negative correlation between single-motor velocity and cargo travel for transport driven by two motors. Our study thus discovers a previously unappreciated role of single-motor velocity in regulating multiple-motor transport.


Figures

Figure 1
Figure 1
Schematic illustration of two-motor transport. The cargo travel begins when at least one of two available motors become bound to the microtubule, and ends when neither motor is bound to the microtubule. During travel, the cargo can be linked to the microtubule via one motor, or both motors simultaneously. For two identical, non-interacting motors, the rates of transition between zero-, one-, and two-motor bound configurations were previously developed (7) and are indicated.
Figure 2
Figure 2
Experimental design for one-, and two-kinesin transport. (A) Illustrations of (i) one- and (ii) two-kinesin transport. Both utilize a monoclonal antibody (γ, against the C-term his-tag of recombinant K560λ) for specific motor recruitment. Both utilize casein (5.55mg/ml) to block antibody-independent, non-specific binding of motors onto beads. For single-kinesin transport (i) (–24), the antibody presence on the bead is effectively saturated, to increase the density of motor binding sites; the motor presence was titrated to the single-motor range. For two-kinesin transport (ii), antibody presence per bead was titrated to be one antibody per bead, and excess kinesin in solution was used to increase the probability that two motors occupy both antigen binding sites of a single antibody. (B) The effect of motor or antibody presence on beads on the fraction of beads capable of binding to microtubules. Starting with excess antibody and excess kinesin per bead (such that all beads bound to microtubules), we significantly reduced the bead binding fraction either by reducing motor concentration (grey bars) or reducing antibody concentration (cyan bars). Thus any observed bead motion along microtubules must be mediated by the antibody-motor complex.
Figure 3
Figure 3
Representative position vs. time traces for a bead carried by two kinesin motors, measured at three distinct ATP concentrations. In the single-antibody range, each bead can recruit no more than two kinesins. We further utilize an optical trap to further select for beads carried by two and only two motors. We measured a ~5pN force production for the single kinesin motor, consistent with previous reports for the same construct (, , –31). We thus adjust the optical trap (~2.5pN/100nm) to be strong enough to trap one kinesin motor (~5pN), but not two (~10pN). Traces within the highlighted grey region correspond to events that do not escape the optical trap. This includes one-motor stalls (red arrows), and two-motors attempts (blue arrows). Green arrows indicate where/when trap was turned off, after observing persistent motion beyond one motor stall, to enable the study of bead travel driven by two active motors under no load.
Figure 4
Figure 4
Velocity and travel distributions of beads carried by (A) one-, and (B) two-kinesins, measured at three ATP concentrations. Histograms are not normalized; Y-axis represents raw experimental counts. Average velocities and travel distances are shown in mean±SEM. Sample numbers are indicated in n. The velocity distributions (left panels in A and B) were well characterized by Gaussian distributions (solid lines). At a given ATP concentration, the average bead velocity did not differ appreciably for two- vs. single- kinesin transport. For single-kinesin transport (right panels in A), at all three ATP concentrations, the measured travel distributions were well described by a single exponential decay (solid lines). The average travel distance of beads driven by a single kinesin remained constant over the ATP concentration examined (1.67 μm). For two-kinesin transport (right panels in B), travel distribution at 1mM ATP was well characterized by a single exponential decay (solid line, see text and Fig. 5 for detailed discussion). At 10 μM and 20 μM ATP, the number of two-motor beads traveling out of camera view (~7.6 μm) became significant, and the total corresponding events are indicated in a hatched bar at 8 μm. We observe a strong, negative correlation between velocity and two-kinesin travel.
Figure 5
Figure 5
Quantitative comparison between theory (Eqn. 4, ref. (7)) and measurements (Fig. 4B). (A) Least-χ2 fitting of Eqn. (4) to the measured two-motor travel distribution at 1mM ATP constrained individual motor’s binding rate to 0.71/s in the two-motor ensemble. (B) Predicted decay lengths and as a function of motor velocity, using the experimentally constrained =0.71/s. The two decay lengths at 0.9 μm/s are indicated in scatter. (C) Predicted two motor travel distributions for the three velocities examined in the current study. Within our measurement window (0.6–7.6 μm, grey region), the predicted distributions at all three velocities measured are dominated by the single exponential with decay length. Measured travel distribution of two-kinesin transport at 0.9 μm/s is shown as scatter. (D) Predicted vs. measured fraction of long travels at 0.26 μm/s and at 0.16 μm/s. The fraction of long travels is defined as the fraction of travel exceeding 7.6 μm in all travels measured (greater than 0.6 μm). Measurement error was determined as p(1-p)/n, where p is the measured long travel fraction, and n the measurement sample size (see Fig. 4B). The predicted populations were calculated using the predicted two-motor travel distributions in (C), and are in excellent agreement with measurements.

References

    1. Miller RH, Lasek RJ. Cross-bridges mediate anterograde and retrograde vesicle transport along microtubules in squid axoplasm. J Cell Biol. 1985;101:2181–93. - PMC - PubMed
    1. Ashkin A, Schutze K, Dziedzic JM, Euteneuer U, Schliwa M. Force generation of organelle transport measured in vivo by an infrared laser trap. Nature. 1990;348:346–8. - PubMed
    1. Kural C, Kim H, Syed S, Goshima G, Gelfand VI, Selvin PR. Kinesin and dynein move a peroxisome in vivo: a tug-of-war or coordinated movement? Science. 2005;308:1469–72. - PubMed
    1. Shubeita GT, Tran SL, Xu J, et al. Consequences of motor copy number on the intracellular transport of kinesin-1-driven lipid droplets. Cell. 2008;135:1098–107. - PMC - PubMed
    1. Hendricks AG, Perlson E, Ross JL, Schroeder HW, 3rd, Tokito M, Holzbaur EL. Motor Coordination via a Tug-of-War Mechanism Drives Bidirectional Vesicle Transport. Curr Biol. 2010;20:697–702. - PMC - PubMed

Publication types