

Dietary restriction attenuates age-associated muscle atrophy by lowering oxidative stress in mice even in complete absence of CuZnSOD
- PMID: 22672615
- PMCID: PMC3444532
- DOI: 10.1111/j.1474-9726.2012.00843.x
Dietary restriction attenuates age-associated muscle atrophy by lowering oxidative stress in mice even in complete absence of CuZnSOD
Abstract
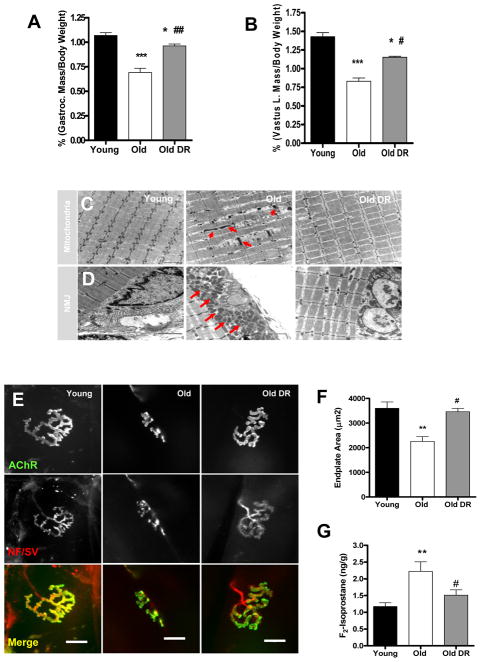
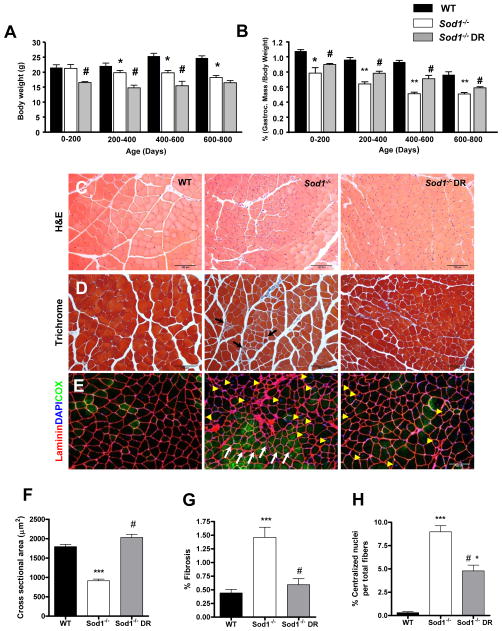
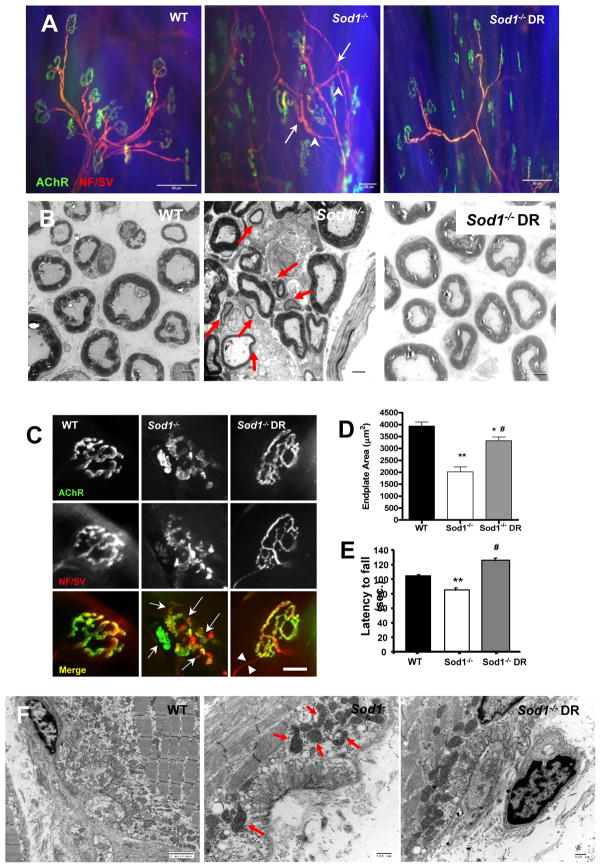
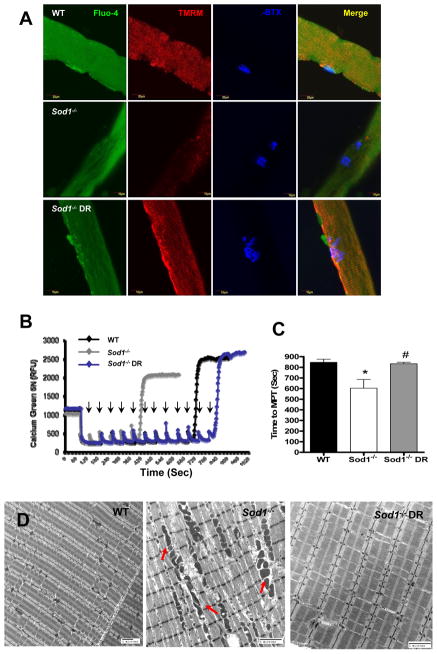
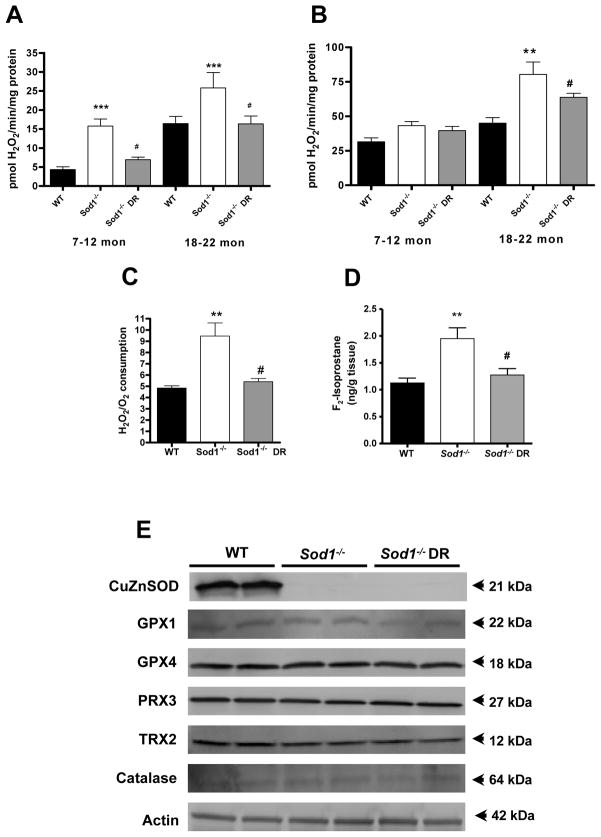
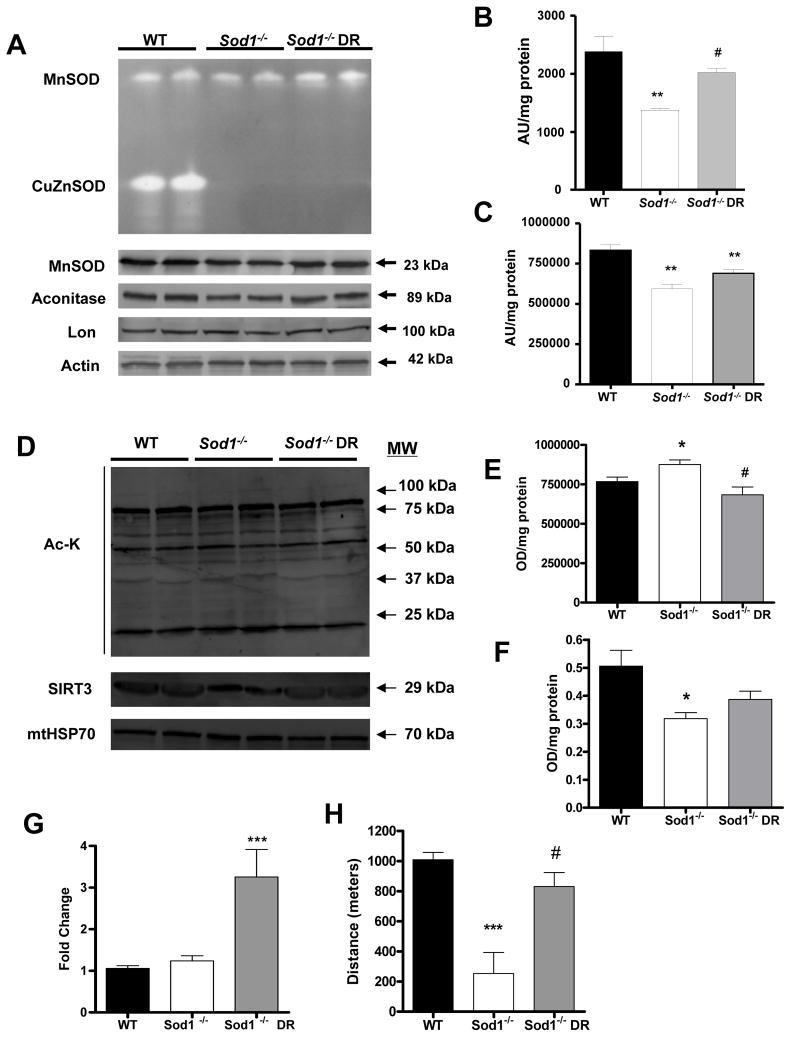
Age-related loss of muscle mass and function, sarcopenia, has a major impact on the quality of life in the elderly. Among the proposed causes of sarcopenia are mitochondrial dysfunction and accumulated oxidative damage during aging. Dietary restriction (DR), a robust dietary intervention that extends lifespan and modulates age-related pathology in a variety of species, has been shown to protect from sarcopenia in rodents. Although the mechanism(s) by which DR modulates aging are still not defined, one potential mechanism is through modulation of oxidative stress and mitochondrial dysfunction. To directly test the protective effect of DR against oxidative stress-induced muscle atrophy in vivo, we subjected mice lacking a key antioxidant enzyme, CuZnSOD (Sod1) to DR (60% of ad libitum fed diet). We have previously shown that the Sod1(-/-) mice exhibit an acceleration of sarcopenia associated with high oxidative stress, mitochondrial dysfunction, and severe neuromuscular innervation defects. Despite the dramatic atrophy phenotype in the Sod1(-/-) mice, DR led to a reversal or attenuation of reduced muscle function, loss of innervation, and muscle atrophy in these mice. DR improves mitochondrial function as evidenced by enhanced Ca2+ regulation and reduction of mitochondrial reactive oxygen species (ROS). Furthermore, we show upregulation of SIRT3 and MnSOD in DR animals, consistent with reduced mitochondrial oxidative stress and reduced oxidative damage in muscle tissue measured as F2-isoprostanes. Collectively, our results demonstrate that DR is a powerful mediator of mitochondrial function, mitochondrial ROS production, and oxidative damage, providing a solid protection against oxidative stress-induced neuromuscular defects and muscle atrophy in vivo even under conditions of high oxidative stress.
© 2012 The Authors. Aging Cell © 2012 Blackwell Publishing Ltd/Anatomical Society of Great Britain and Ireland.
Figures
Similar articles
-
Neuron specific reduction in CuZnSOD is not sufficient to initiate a full sarcopenia phenotype.Redox Biol. 2015 Aug;5:140-148. doi: 10.1016/j.redox.2015.04.005. Epub 2015 Apr 15. Redox Biol. 2015. PMID: 25917273 Free PMC article.
-
Increased superoxide in vivo accelerates age-associated muscle atrophy through mitochondrial dysfunction and neuromuscular junction degeneration.FASEB J. 2010 May;24(5):1376-90. doi: 10.1096/fj.09-146308. Epub 2009 Dec 29. FASEB J. 2010. PMID: 20040516 Free PMC article.
-
Reactive oxygen species in the pathogenesis of sarcopenia.Free Radic Biol Med. 2025 Feb 1;227:446-458. doi: 10.1016/j.freeradbiomed.2024.11.046. Epub 2024 Nov 28. Free Radic Biol Med. 2025. PMID: 39613046 Free PMC article. Review.
-
Neuron-specific expression of CuZnSOD prevents the loss of muscle mass and function that occurs in homozygous CuZnSOD-knockout mice.FASEB J. 2014 Apr;28(4):1666-81. doi: 10.1096/fj.13-240390. Epub 2013 Dec 30. FASEB J. 2014. PMID: 24378874 Free PMC article.
-
The effects of dietary restriction on oxidative stress in rodents.Free Radic Biol Med. 2014 Jan;66:88-99. doi: 10.1016/j.freeradbiomed.2013.05.037. Epub 2013 Jun 4. Free Radic Biol Med. 2014. PMID: 23743291 Free PMC article. Review.
Cited by
-
Unraveling the causes of sarcopenia: Roles of neuromuscular junction impairment and mitochondrial dysfunction.Physiol Rep. 2024 Jan;12(1):e15917. doi: 10.14814/phy2.15917. Physiol Rep. 2024. PMID: 38225199 Free PMC article. Review.
-
Adaptive Remodeling of the Neuromuscular Junction with Aging.Cells. 2022 Mar 29;11(7):1150. doi: 10.3390/cells11071150. Cells. 2022. PMID: 35406714 Free PMC article. Review.
-
Molecular changes associated with spinal cord aging.Geroscience. 2020 Apr;42(2):765-784. doi: 10.1007/s11357-020-00172-6. Epub 2020 Mar 6. Geroscience. 2020. PMID: 32144690 Free PMC article.
-
Beneficial effects of dietary supplementation with green tea catechins and cocoa flavanols on aging-related regressive changes in the mouse neuromuscular system.Aging (Albany NY). 2021 Jul 28;13(14):18051-18093. doi: 10.18632/aging.203336. Epub 2021 Jul 28. Aging (Albany NY). 2021. PMID: 34319911 Free PMC article.
-
Accelerated sarcopenia in Cu/Zn superoxide dismutase knockout mice.Free Radic Biol Med. 2019 Feb 20;132:19-23. doi: 10.1016/j.freeradbiomed.2018.06.032. Epub 2018 Jul 2. Free Radic Biol Med. 2019. PMID: 30670156 Free PMC article. Review.
References
-
- Jang YC, Lustgarten MS, Liu Y, Muller FL, Bhattacharya A, Liang H, Salmon AB, Brooks SV, Larkin L, Hayworth CR, et al. Increased superoxide in vivo accelerates age-associated muscle atrophy through mitochondrial dysfunction and neuromuscular junction degeneration. FASEB J. 2010;24:1376–1390. - PMC - PubMed
-
- Mansouri A, Muller FL, Liu Y, Ng R, Faulkner J, Hamilton M, Richardson A, Huang TT, Epstein CJ, Van Remmen H. Alterations in mitochondrial function, hydrogen peroxide release and oxidative damage in mouse hind-limb skeletal muscle during aging. Mech Ageing Dev. 2006;127:298–306. - PubMed
-
- Weindruch R. Interventions based on the possibility that oxidative stress contributes to sarcopenia. J Gerontol A Biol Sci Med Sci. 1995;50(Spec No):157–161. - PubMed
-
- Faulkner JA, Larkin LM, Claflin DR, Brooks SV. Age-related changes in the structure and function of skeletal muscles. Clin Exp Pharmacol Physiol. 2007;34:1091–1096. - PubMed
Publication types
MeSH terms
Substances
Grants and funding
LinkOut - more resources
Full Text Sources
Miscellaneous
