. 2012 Aug;153(8):3949-59.
doi: 10.1210/en.2012-1059. Epub 2012 Jun 6.

EGF-like factors induce expansion of the cumulus cell-oocyte complexes by activating calpain-mediated cell movement

Affiliations

EGF-like factors induce expansion of the cumulus cell-oocyte complexes by activating calpain-mediated cell movement

Ikko Kawashima et al. Endocrinology. 2012 Aug.

Abstract

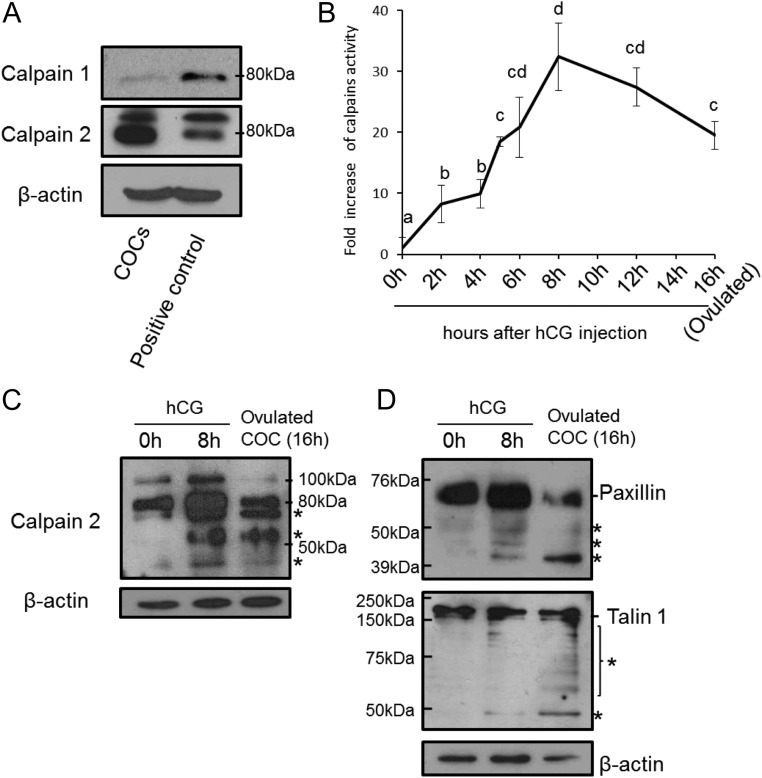
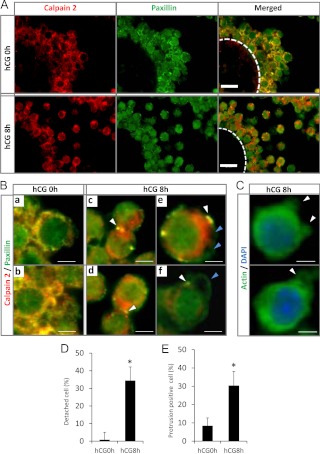
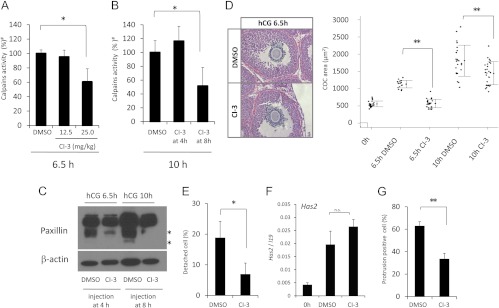
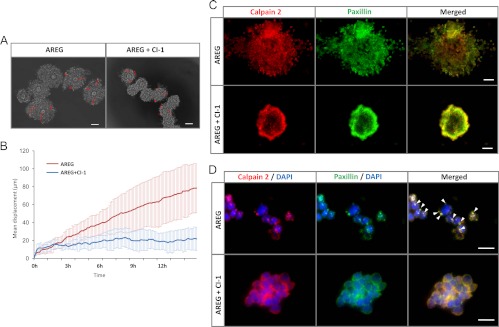
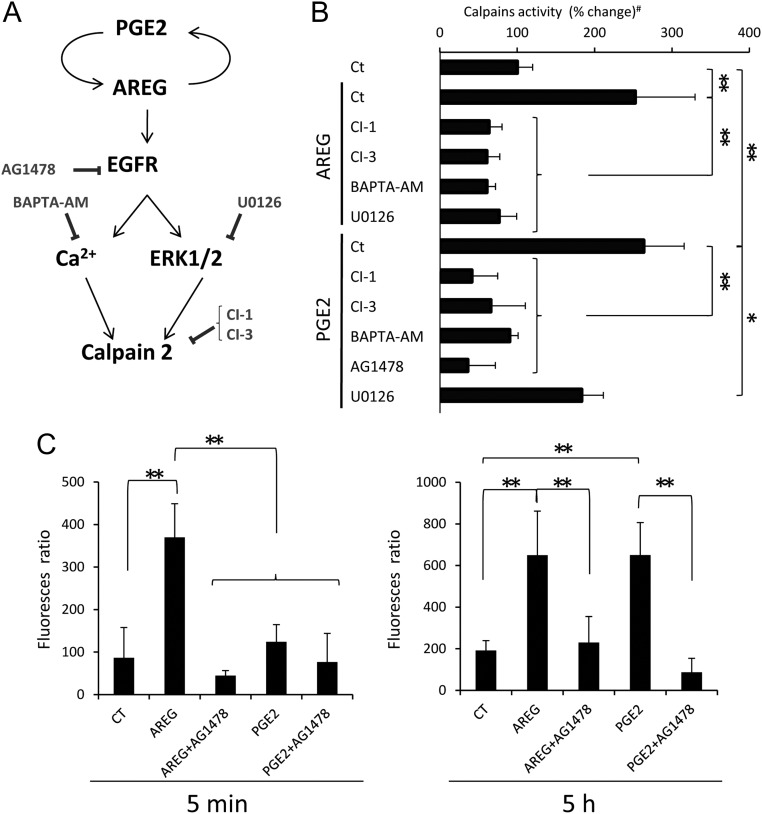
Cumulus cell-oocyte complex (COC) expansion is obligatory for LH-induced ovulation and is initiated by LH induction of the epidermal growth factor (EGF)-like factors that mediate the synthesis of the hyaluronan-rich matrix and hyaluronan-stabilizing factors. COC expansion also involves the movement of cumulus cells within the matrix by mechanisms that have not been characterized. We document herein that two proteases, calpain 2 and to a lesser extent calpain 1, are expressed in cumulus cells and that the proteolytic activity of these enzymes is rapidly and significantly increased in COC isolated from human chorionic gonadotropin-induced ovulatory follicles in vivo. Stimulation of calpain activity was associated with proteolytic degradation of paxillin and talin (two components of focal adhesion complexes), cell detachment, and the formation of cell surface bleb-like protrusions. Injection of a calpain inhibitor in vivo reduced 1) human chorionic gonadotropin-stimulated calpain enzyme activity, 2) cell detachment, 3) membrane protrusion formation, and 4) COC expansion by mechanisms that did not alter Has2 expression. During EGF-like factor induction of COC expansion in culture, calpain activity was increased by ERK1/2 and intracellular Ca(2+) signaling pathways. Inhibition of calpain activity in cultured COC blocked cumulus cell detachment, protrusion formation, and the vigorous movement of cumulus cells. As a consequence, COC expansion was impaired. Collectively, these results show that two highly coordinated processes control COC expansion. One process involves the synthesis of the hyaluronan matrix, and the other mediates cumulus cell detachment and movement. The latter are controlled by calpain activation downstream of the EGF receptor activation of the Ca(2+) pathway and ERK1/2 pathways.


Figures

Fig. 1.
Fig. 1.
Expression and activation of calpain isoforms in ovulating COC recovered from eCG- and hCG-treated mice. A, Levels of calpain 1 and calpain 2 protein in the COC or brain (positive control) from mice 48 h after eCG priming were analyzed by immunoblot. β-Actin was used as a loading control. B, Calpain activity in COC as assessed by fluorescent determination of the cleavage of a specific calpain substrate (5-FAM/OXLTM). a–d, No common letters are significant (P < 0.05). Values represent the mean ± sem of three replicates. *, For reference, the value of the 0-h sample was set as 1, and the data are presented as fold increase. C, Immunoblot analysis of calpain 2 cleavage forms in COC recovered from eCG-primed mice before (hCG 0 h) or 8 or 16 h after hCG. The asterisks indicate the cleaved forms of calpain 2 and the low-molecular-mass forms of calpain are known to contain the activated catalytic region (28). β-Actin was used as a loading control. D, Immunoblot analysis of calpain substrates paxillin and talin in COC recovered from eCG-primed mice before (0 h) or at 8 or 16 h after hCG. The asterisks indicate cleavage products. β-Actin was used as a loading control.
Fig. 2.
Fig. 2.
The localization of calpain 2 and paxillin in cumulus cells of COC during cumulus expansion in vivo. A, Cross-sections of mouse COC were stained with antibodies to visualize either calpain 2 (red) or paxillin (green) at 0 and 8 h after hCG (scale bars, 20 μm). Circle with white line shows the localization of the oocyte. B, High-magnification views of cumulus cells immunostained for calpain 2 (red) and paxillin (green) corresponding to the ones shown in A; a and b, double immunostaining of calpain 2 and paxillin in cumulus cells from eCG-injected mice (hCG 0 h) (scale bars, 5 μm); c and d, calpain 2 and paxillin colocalize to cell-cell adhesion sites (white arrowheads) in cumulus cells at 8 h after hCG injection (scale bars, 5 μm); e and f, calpain 2 and paxillin colocalize to specific sites at the base of cell surface protrusions (white arrowheads) but not on the surface of protrusion (blue arrowheads) in cumulus cells at 8 h after hCG injection (scale bars, 3 μm). C, The localization of α-actin in cumulus cells of COC recovered from mice at 8 h after hCG injection. Immunofluorescent images localize α-actin (green) and nuclei [4′,6-diamidino-2-phenylindole (DAPI); blue]. α-actin is accumulated within protrusions (white arrowheads). D, The percentage of detached cumulus cells in COC, five COC in each section (section number is five, total 25 COC) were used for this analysis. *, The number of detached cells was significantly higher in COC recovered from mice 8 h after hCG injection as compared with that in control COC at 0 h hCG (P < 0.01). Values are mean ± sem of three replicates. E, The number of cumulus cells with protrusions in COC, five COC in each section (section number is five, total 25 COC) were used for this analysis. *, The number of cells with protrusions was significantly higher in COC recovered from mice 8 h after hCG injection as compared with that in COC of hCG 0-h mice (P < 0.01). Values are mean ± sem of three replicates.
Fig. 3.
Fig. 3.
Pharmacological inhibition of calpain activity using CI-3 in vivo. A, Calpain activity in COC recovered from mice 6.5 h after hCG injection, Calpain activity in COC was assessed by fluorescent determination of the cleavage of a specific calpain substrate (5-FAM/OXLTM). Mice (n > 3 for each group) were treated at 4 h after hCG with DMSO or with either 12.5 or 25.0 mg/kg CI-3. At 2.5 h later, the mice were scarified for use in the calpain activity assay. *, The injection of 25 mg/kg CI-3 significantly decreased calpain activity as compared with that in control mice injected with DMSO (P < 0.05). #, The value of the control sample (DMSO) was set as 100, and the data are presented as a ratio. Values are mean ± sem of three replicates. B, Calpain activity in COC collected 10 h after hCG injection. Mice were injected with DMSO or 25 mg/kg of CI-3 at 4 or 8 h after hCG. Treatment of COC with CI-3 at 4 h did not significantly suppress calpain activity at 10 h after hCG. However, the same treatment at 8 h significantly decreased enzyme activity at 10 h after hCG injection (CI-3 at 8 h) as compared with that in control (DMSO injection) (*, P < 0.05). Values are mean ± sem of three replicates. C, The effects of a calpain inhibitor on the cleavage of paxillin. Mice were injected with DMSO or 25 mg/kg CI-3 at 4 or 8 h after hCG, and then COC were recovered at 6.5 or 10 h, respectively. Total lysates of COC obtained from mice treated with DMSO and CI-3 (25 mg/kg) were separated by SDS-PAGE, and paxillin was detected by immunoblotting. The asterisks indicate cleavage products. β-Actin was used as a loading control. D, The left panel shows an image of COC expansion at 6.5 h after hCG injection when DMSO or 25 mg/kg of CI-3 was injected at 4 h after hCG. The right scatter graph shows the individual areas of COC in sections containing an oocyte with a nucleus. Sections were obtained from mice treated with DMSO or CI-3 (25 mg/kg) (**, P < 0.01; n = 3 animals per condition). E, The number of detached cumulus cells in each COC, five COC in each ovary (section number is five, total 25 of COC in each treatment group) were used for this analysis (*, P < 0.05). The ovaries were collected from mice injected at 4 h after hCG treatment with DMSO or 25 mg/kg CI-3 and killed at 6.5 h after hCG. Values are mean ± sem of five replicates. F, The expression levels of Has2 in cumulus cells of COC recovered from mice 6.5 h after hCG injection when DMSO or 25 mg/kg of CI-3 was injected at 4 h after hCG. (0 h) COC were recovered from eCG-primed mice. Values are mean ± sem of three replicates. G, The number of cumulus cells with protrusions in each COC, five COC in each ovary (section number is five, total 25 of COC in each treatment group) were used for this analysis (**, P < 0.01). The ovaries were collected from mice at 10 h after hCG injection when DMSO or 25 mg/kg CI-3 was injected at 8 h after hCG. Values are mean ± sem of five replicates.
Fig. 4.
Fig. 4.
CI-1 impedes cumulus cell movement and expansion. A, Movement tracks of cumulus cells (nine cells for each treatment) from 4–16 h are displayed as a red line. Time-lapse images, taken at 6-min intervals, were captured for 12 h from 4–16 h (Supplemental Movies 1 and 2). Scale bars, 100 μm. B, Displacement of cumulus cells plotted against time (hour). Red line, mean motility of nine cumulus cells in the AREG treatment group from time-lapse imaging; blue line, mean motility of nine cumulus cells in the AREG + CI-1 treatment from time-lapse imaging. C, COC were pretreated with or without CI-1 and then stimulated with AREG for 8 h. After culture, COC were fixed and stained with anti-calpain 2 antibody (red) and paxillin (green) antibody. Scale bars, 50 μm. D, To observe the localization of calpain 2 and paxillin in more detail, COC were fixed by 4% (wt/vol) paraformaldehyde/PBS, and then some clusters of cumulus cells were gently separated from COC using a pipette. The clusters were mounted on glass slides to obtain the magnified images. Scale bars, 10 μm. Protrusions on the cumulus cell surface are indicated with white arrowheads. Nuclei were stained by 4′,6-diamidino-2-phenylindole (DAPI) (blue).
Fig. 5.
Fig. 5.
Cumulus expansion is regulated by EGFR-Ca2+-induced calpain activity. A, Schematic diagram shows the signaling pathways in COC and inhibitors that might activate or block calpain activity and COC expansion (7). B, Total calpain activity was measured in COC that were precultured with the EGFR tyrosine kinase inhibitor (AG1478), calcium chelator (BAPTA-AM), MEK1/2 inhibitor (U0126), or calpain inhibitors (CI-1 or CI-3) for 30 min and then cultured with either AREG or PGE2 for 5 h. AREG significantly increased the activity of calpain (**, P < 0.01). This induction was significantly suppressed by CI-1, CI-3, BAPTA-AM, or U0126, respectively (**, P < 0.01). PGE2 also significantly increased the level of calpain activity (**, P < 0.01). The induction was significantly and dramatically suppressed by CI-1, CI-3, BAPTA-AM, or AG1478 (**, P < 0.01). U0126 also slightly but significantly decreased the calpain activity (*P < 0.05). Values are mean ± sem of three replicates. #, The value of control sample (COC were cultured without any agonists and inhibitors) was set as 100, and the data are presented as percentage. C, The levels of Ca2+ in cumulus cells of COC. COC were preincubated with Fura2-acetoxymethylester and then cultured with AREG or PGE2 for 5 min (left) or 5 h (right). After culture, the level of Ca2+ uptake was measured as the level of 334-nm/365-nm fura-2 fluorescence ratios. Values are mean ± sem of three replicates. At 5 min, the level of Ca2+ in COC was significantly increased by AREG treatment as compared with that in COC without any agonist (control) (**, P < 0.01). The AREG-induced increase of Ca2+ was significantly suppressed by AG1478 (**, P < 0.01). PGE2 did not significantly increase the level of Ca2+ at 5 min. After 5 h culture, not only AREG but also PGE2 significantly increased the level of Ca2+ (**, P < 0.01). The inductions were significantly decreased by AG1478 (**, P < 0.01).

Similar articles

Cited by

References

    1. Eppig JJ. 1991. Inter communication between mammalian oocytes and companion somatic cells. Bioessays 13:569–574 - PubMed
    1. Kidder GM, Mhawi AA. 2002. Gap junctions and ovarian folliculogenesis. Reproduction 123:613–620 - PubMed
    1. Larsen WJ, Wert SE, Brunner GD. 1987. Differential modulation of rat follicle cell gap junction populations at ovulation. Dev Biol 122:61–71 - PubMed
    1. Zhang M, Su YQ, Sugiura K, Xia G, Eppig JJ. 2010. Granulosa cell ligand NPPC and its receptor NPR2 maintain meiotic arrest in mouse oocytes. Science 330:366–369 - PMC - PubMed
    1. Dekel N, Kraicer PF. 1978. Induction in vitro of mucification of rat cumulus oophorus by gonadotrophins and adenosine 3′,5′-monophosphate. Endocrinology 102:1797–1802 - PubMed

Publication types