. 2012 Aug 1;303(3):C244-56.
doi: 10.1152/ajpcell.00414.2011. Epub 2012 Jun 6.

Inflammation alters regional mitochondrial Ca²+ in human airway smooth muscle cells

Affiliations

Inflammation alters regional mitochondrial Ca²+ in human airway smooth muscle cells

Philippe Delmotte et al. Am J Physiol Cell Physiol. .

Abstract

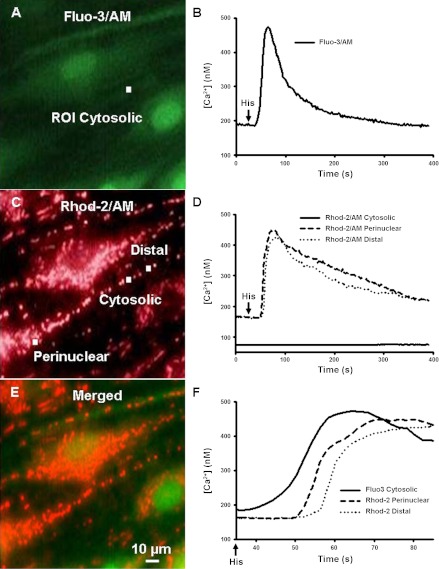
Regulation of cytosolic Ca(2+) concentration ([Ca(2+)](cyt)) in airway smooth muscle (ASM) is a key aspect of airway contractility and can be modulated by inflammation. Mitochondria have tremendous potential for buffering [Ca(2+)](cyt), helping prevent Ca(2+) overload, and modulating other intracellular events. Here, compartmentalization of mitochondria to different cellular regions may subserve different roles. In the present study, we examined the role of Ca(2+) buffering by mitochondria and mitochondrial Ca(2+) transport mechanisms in the regulation of [Ca(2+)](cyt) in enzymatically dissociated human ASM cells upon exposure to the proinflammatory cytokines TNF-α and IL-13. Cells were loaded simultaneously with fluo-3 AM and rhod-2 AM, and [Ca(2+)](cyt) and mitochondrial Ca(2+) concentration ([Ca(2+)](mito)) were measured, respectively, using real-time two-color fluorescence microscopy in both the perinuclear and distal, perimembranous regions of cells. Histamine induced a rapid increase in both [Ca(2+)](cyt) and [Ca(2+)](mito), with a significant delay in the mitochondrial response. Inhibition of the mitochondrial Na(+)/Ca(2+) exchanger (1 μM CGP-37157) increased [Ca(2+)](mito) responses in perinuclear mitochondria but not distal mitochondria. Inhibition of the mitochondrial uniporter (1 μM Ru360) decreased [Ca(2+)](mito) responses in perinuclear and distal mitochondria. CGP-37157 and Ru360 significantly enhanced histamine-induced [Ca(2+)](cyt). TNF-α and IL-13 both increased [Ca(2+)](cyt), which was associated with decreased [Ca(2+)](mito) in the case of TNF-α but not IL-13. The effects of TNF-α on both [Ca(2+)](cyt) and [Ca(2+)](mito) were affected by CGP-37157 but not by Ru360. Overall, these data demonstrate that in human ASM cells, mitochondria buffer [Ca(2+)](cyt) after agonist stimulation and its enhancement by inflammation. The differential regulation of [Ca(2+)](mito) in different parts of ASM cells may serve to locally regulate Ca(2+) fluxes from intracellular sources versus the plasma membrane as well as respond to differential energy demands at these sites. We propose that such differential mitochondrial regulation, and its disruption, may play a role in airway hyperreactivity in diseases such as asthma, where [Ca(2+)](cyt) is increased.


Figures

Fig. 1.
Fig. 1.
Dye loading of human airway smooth muscle (ASM) cells. A and B: fluorescence images of human ASM cells loaded with 2.5 μM fluo-3 AM (A) and 2.5 μM rhod-2 AM (B) to estimate cytosolic ([Ca2+]cyt) and mitochondrial Ca2+ concentration ([Ca2+]mito), respectively. C: relative distribution of fluo-3 AM and rhod-2 AM fluorescence with the merged image of the two fluorescence images. D and E: in a separate set of experiments, human ASM cells were loaded simultaneously with rhod-2 AM (D) and then with 500 nM MitoTracker green (E) for 5 min to visualize mitochondria and showed consistent and matching patterns of mitochondria in the perinuclear areas and more distal (potentially perimembranous) areas of cells. F: an overlay of the two fluorescence images confirmed that the pattern of rhod-2 staining was mainly within mitochondria. G and H: in additional experiments, ASM cells were loaded with 1 μM BODIPY-FL-thapsigargin (G; endoplasmic reticulum Ca2+ pumps) and then with 500 nM MitoTracker red CMXRos (H). I: overlays of the two fluorescence images along with image analysis of the mitochondrial network were used to define the perinuclear regions. N, nucleus. Bars = 10 μm.
Fig. 2.
Fig. 2.
Transient increases in rhod-2 fluorescence are localized within mitochondria. A and B: fluorescence images of human ASM cells loaded with MitoTracker green (A) and rhod-2 AM (B). C: overlay of the two fluorescence images with examples of regions of interest (ROIs) chosen within the mitochondria (region 1), in the cytosol (region 2), and near mitochondria (region 3), where some background fluorescence could be detected. Bar = 10 μm. D: measurement of rhod-2 fluorescence expressed as [Ca2+] (in nM) in the ROIs shown in C. A transient increase in [Ca2+] in response to histamine (His; 10 μM) was observed for the ROI chosen within the mitochondria (region 1, solid line) and not for the ROIs placed in either the cytosol (region 2, dotted line) or near the mitochondria (region 3, dashed line). E and F: MitoTracker green-loaded cells excited at 488 nm showed significant specific fluorescence at 501 nm, corresponding to MitoTracker green (E), whereas excitation of the cells at 568 nm (rhod-2 AM excitation wavelength) did not show significant (above background) fluorescence at 590 nm (F). G and H: similarly, excitation of ASM cells loaded with 2.5 μM rhod-2 AM at 488 nm (G; Mitotracker green excitation wavelength) did not result in any nonspecific fluorescence at 501 nm (above background), whereas excitation at 568 nm resulted in specific fluorescence at 590 nm, corresponding to rhod-2 AM (H). Ex, excitation; Em, emission.
Fig. 3.
Fig. 3.
Measurement of [Ca2+]cyt and [Ca2+]mito in human ASM cells. A: fluorescence image of human ASM cells loaded with fluo-3 AM with an example of the ROI used to measure [Ca2+]cyt. B: 10 μM His first induced a rise in [Ca2+]cyt. C: the same ROI was used to measure the change in [Ca2+]mito with the same cells simultaneously loaded with rhod-2 AM. Examples of the ROIs used to measure [Ca2+]mito in the perinuclear and distal regions are also shown. D: traces obtained from the ROIs in C showed that the changes in fluorescence only occur when the ROIs are placed within the mitochondria in either the distal (dotted line) or perinuclear (dashed line) region of the cells. E and F: an overlay of the two fluorescence images (E) along with a time-extended view of [Ca2+] responses (F) from the graphs in B and D showed a significant delay between [Ca2+]cyt and [Ca2+]mito responses. Histamine (His) was added at 30 s.
Fig. 4.
Fig. 4.
Comparison of [Ca2+]cyt and [Ca2+]mito in human ASM. A: basal [Ca2+]cyt and [Ca2+]mito from mitochondria in the distal versus perinuclear regions of cells and the His effect on the amplitude of [Ca2+] responses (peak amplitude, n = 31). Values are means ± SE. B: effect of inhibited mitochondrial transport on the delay (in s) between [Ca2+]cyt and [Ca2+]mito. When measured at the initiation of either response, the delay between [Ca2+]cyt and [Ca2+]mito was estimated at 11 ± 3 and 9 ± 3 s for the mitochondria localized in the perinuclear or distal regions of the cells, respectively. Inhibition of the mitochondrial uniporter (MCU) with Ru360 increased this delay for both mitochondria in the perinuclear regions (15 ± 2 s) and distal regions of the cells (16 ± 3 s). CGP-37157 (CGP) had no effect on the delays between [Ca2+]cyt and [Ca2+]mito. *Significant effect (P < 0.05).
Fig. 5.
Fig. 5.
Effect of inhibited mitochondrial transport on [Ca2+]cyt and [Ca2+]mito. ASM cells loaded with fluo-3 AM and rhod-2 AM were exposed to 10 μM His. A: compared with control cells (solid line), inhibition of MCU with Ru360 (dotted line) increased [Ca2+]cyt induced by His (10 μM). A similar result was obtained when the mitochondrial Na+/Ca2+ exchanger (NCX) was inhibited with CGP (dashed line). B and C: compared with control cells (solid line), Ru360 (dotted line) decreased [Ca2+]mito induced by His (10 μM) in the perinuclear regions (B) or distal regions (C) of the cells. CGP (dashed line) increased [Ca2+]mito in the perinuclear regions (B) but not in the distal regions (C) of the cells.
Fig. 6.
Fig. 6.
A–C: summary of the effects of inhibited mitochondrial transport on the amplitude of the [Ca2+]cyt response (expressed as a percentage of control; A), the amplitude of the [Ca2+]mito amplitude (B), and the rate of fall (C; expressed as a percentage of control and corresponding to the areas under the curves, starting at the peak until the return to the basal Ca2+ level). Ru360 did not affect the decay of the [Ca2+]cyt responses but decreased the associated rate of fall of [Ca2+]mito for both the perinuclear and distal regions of the cells. CGP increased the rate of fall of [Ca2+]cyt responses, which was accompanied by a decrease in the decay of [Ca2+]mito responses. Values are means ± SE. *Significant effect (P < 0.05).
Fig. 7.
Fig. 7.
Effect of the proinflammatory cytokine TNF-α and inhibited mitochondrial transport on [Ca2+]cyt and [Ca2+]mito. ASM cells incubated for 48 h with TNF-α and then loaded with fluo-3 AM and rhod-2 AM were exposed to 10 μM His. A: compared with the vehicle control, TNF-α increased [Ca2+]cyt responses induced by His (10 μM). A similar result was obtained when MCU was inhibited with Ru360 (dotted line). Inhibition of mitochondrial NCX with CGP (dashed line) decreased [Ca2+]cyt in TNF-α-exposed cells. B and C: TNF-α decreased [Ca2+]mito responses to His measured from mitochondria in the perinuclear regions (B) but not from mitochondria in the distal regions of cells (C). Ru360 did not further decrease [Ca2+]mito in TNF-α-exposed cells. In contrast, CGP significantly increased [Ca2+]mito measured from mitochondria in the perinuclear regions of cells but not from mitochondria in the distal regions.
Fig. 8.
Fig. 8.
A and B: summary of the effect of TNF-α and inhibited mitochondrial transport on the amplitude of [Ca2+]cyt (A) and [Ca2+]mito (B) responses. C: the rate of fall expressed as a percentage of the vehicle control and corresponding to the areas under the curves (starting at the peak until the return to the basal Ca2+ level). TNF-α increased the decay of [Ca2+]cyt and decreased the decay of [Ca2+]mito responses from the distal regions of the cells. Ru360 increased the decay of [Ca2+]cyt responses but not [Ca2+]mito responses. Compared with the vehicle control, CGP increased the decay of [Ca2+]cyt and [Ca2+]mito responses from the perinuclear regions of the cells. Values are means ± SE. *Significant effect (P < 0.05).
Fig. 9.
Fig. 9.
Effect of IL-13 and inhibited mitochondrial transport on [Ca2+]cyt and [Ca2+]mito. A: compared with the vehicle control, IL-13 increased [Ca2+]cyt responses to His. Inhibition of MCU with Ru360 (dotted line) further increased [Ca2+]cyt responses in IL-13-exposed cells, whereas inhibition of mitochondrial NCX with CGP (dashed line) decreased [Ca2+]cyt responses. B and C: effects of IL-13 and inhibited mitochondrial transport on [Ca2+]mito responses. Compared with the vehicle control, IL-13 had no effect on [Ca2+]mito responses to His measured from both mitochondria in the perinuclear (B) and distal (C) regions of cells. Ru360 significantly decreased [Ca2+]mito in IL-13-exposed cells, whereas CGP increased [Ca2+]mito responses measured from mitochondria in the perinuclear regions but not from mitochondria in the distal regions of cells.
Fig. 10.
Fig. 10.
A and B: summary of the effects of IL-13 and inhibited mitochondrial transport on the amplitude of [Ca2+]cyt (A) and [Ca2+]mito (B) responses (expressed as a percentage of the vehicle control). Values are means ± SE. *Significant effect (P < 0.05). C: the rate of fall expressed as a percentage of the vehicle control and corresponding to the areas under the curves (starting at the peak until the return to the basal Ca2+ level). IL-13 increased the decay of [Ca2+]cyt and [Ca2+]mito responses from the distal regions of the cells, whereas it decreased the decay of [Ca2+]mito responses from the perinuclear regions. Ru360 did not further increased the decay of [Ca2+]cyt responses but decreased the decay of [Ca2+]mito responses from both the perinuclear and distal regions of the cells. Compared with the vehicle control, CGP increased the decay of [Ca2+]cyt and [Ca2+]mito responses from the perinuclear regions of the cells. Values are means ± SE. *Significant effect (P < 0.05).

Similar articles

Cited by

References

    1. Aguilera-Aguirre L, Bacsi A, Saavedra-Molina A, Kurosky A, Sur S, Boldogh I. Mitochondrial dysfunction increases allergic airway inflammation. J Immunol 183: 5379–5387, 2009 - PMC - PubMed
    1. Amrani Y. TNF-alpha and calcium signaling in airway smooth muscle cells: a never-ending story with promising therapeutic relevance. Am J Respir Cell Mol Biol 36: 387–388, 2007 - PubMed
    1. Amrani Y, Chen H, Panettieri RA., Jr Activation of tumor necrosis factor receptor 1 in airway smooth muscle: a potential pathway that modulates bronchial hyper-responsiveness in asthma? Respir Res 1: 49–53, 2000 - PMC - PubMed
    1. Amrani Y, Panettieri RA., Jr Modulation of calcium homeostasis as a mechanism for altering smooth muscle responsiveness in asthma. Curr Opin Allergy Clin Immunol 2: 39–45, 2002 - PubMed
    1. Ay B, Prakash YS, Pabelick CM, Sieck GC. Store-operated Ca2+ entry in porcine airway smooth muscle. Am J Physiol Lung Cell Mol Physiol 286: L909–L917, 2004 - PubMed

Publication types

MeSH terms

LinkOut - more resources