. 2012 Jul;13(9):793-803.
doi: 10.4161/cbt.20562. Epub 2012 Jun 7.

Sorafenib and pemetrexed toxicity in cancer cells is mediated via SRC-ERK signaling

Affiliations

Sorafenib and pemetrexed toxicity in cancer cells is mediated via SRC-ERK signaling

M Danielle Bareford et al. Cancer Biol Ther. 2012 Jul.

Abstract

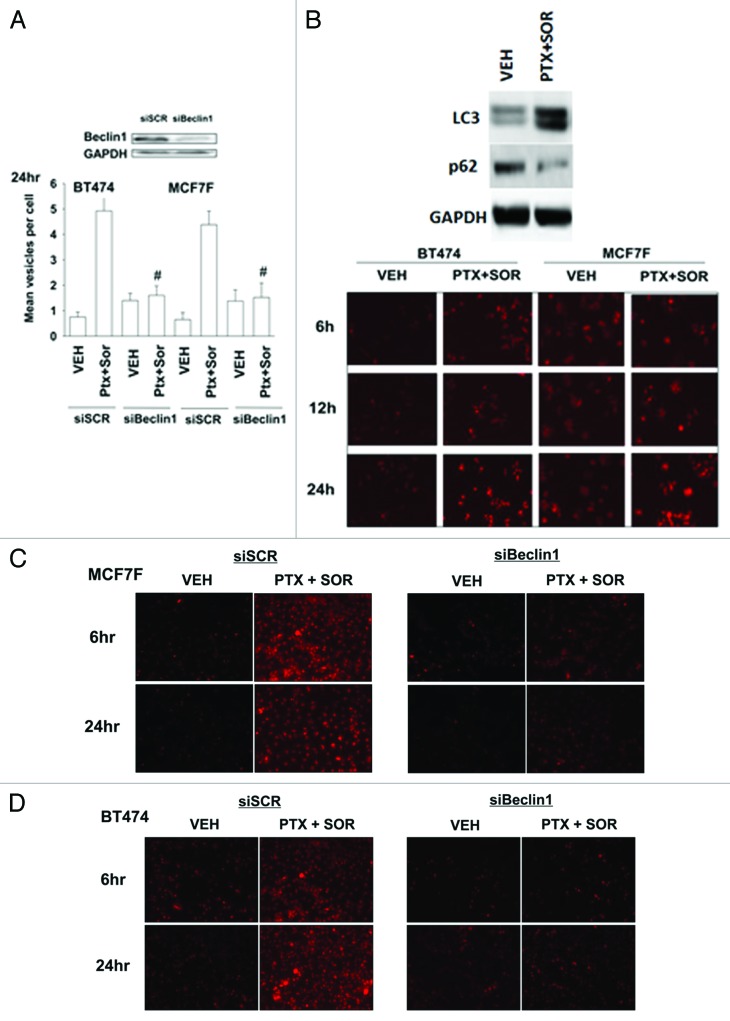
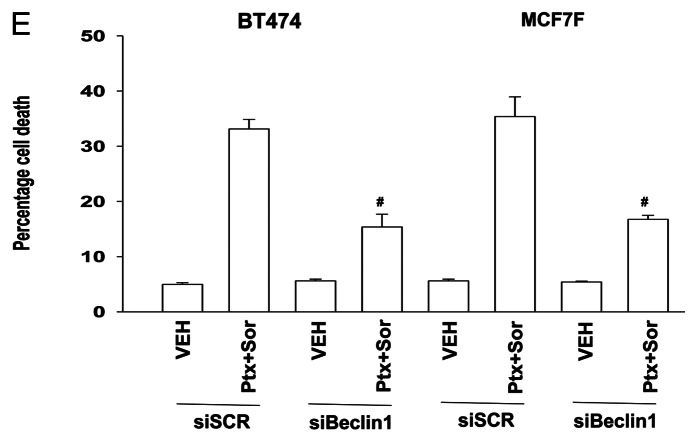
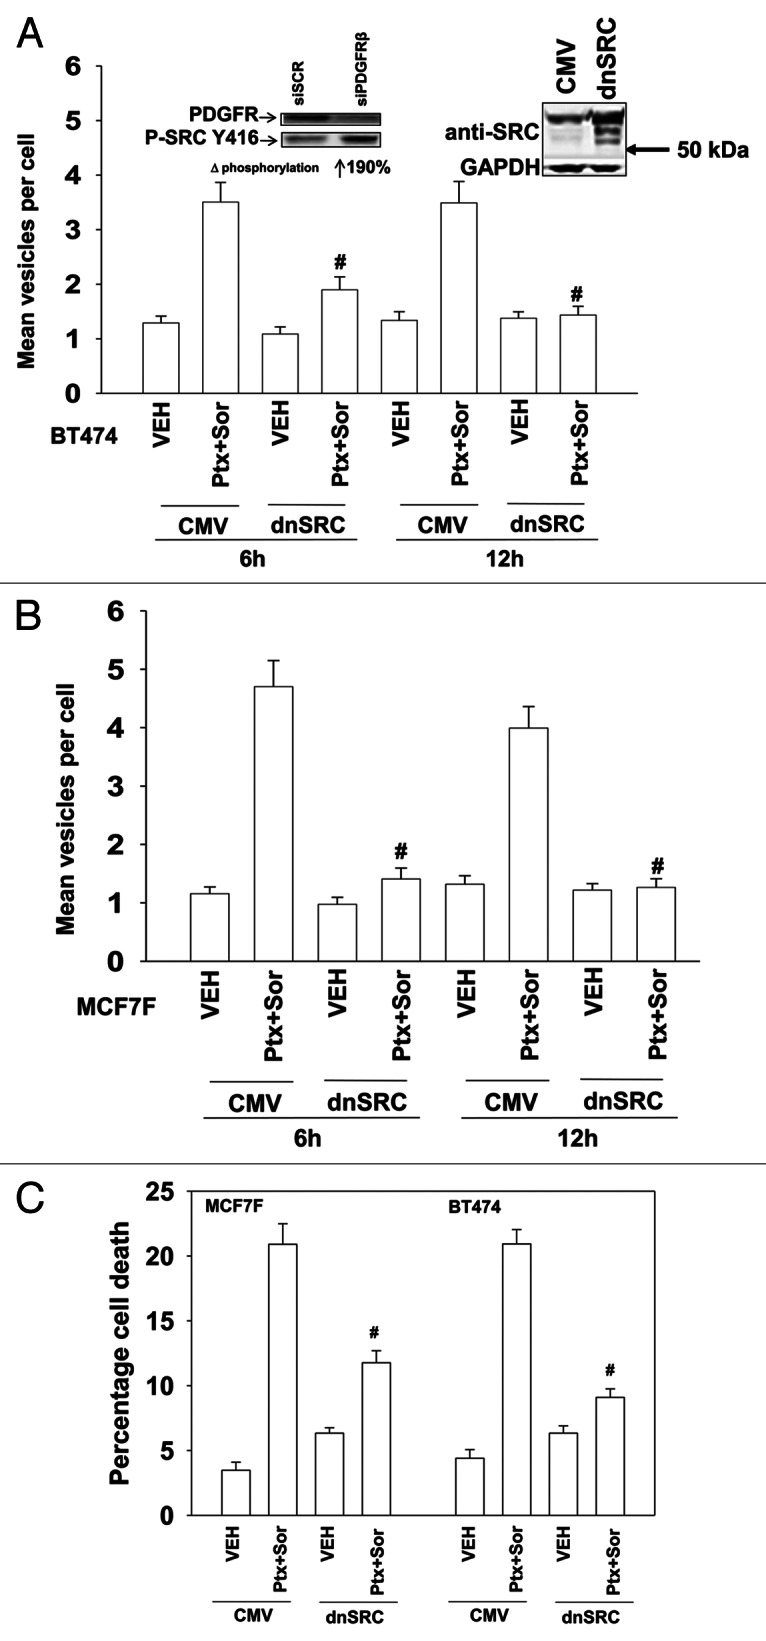
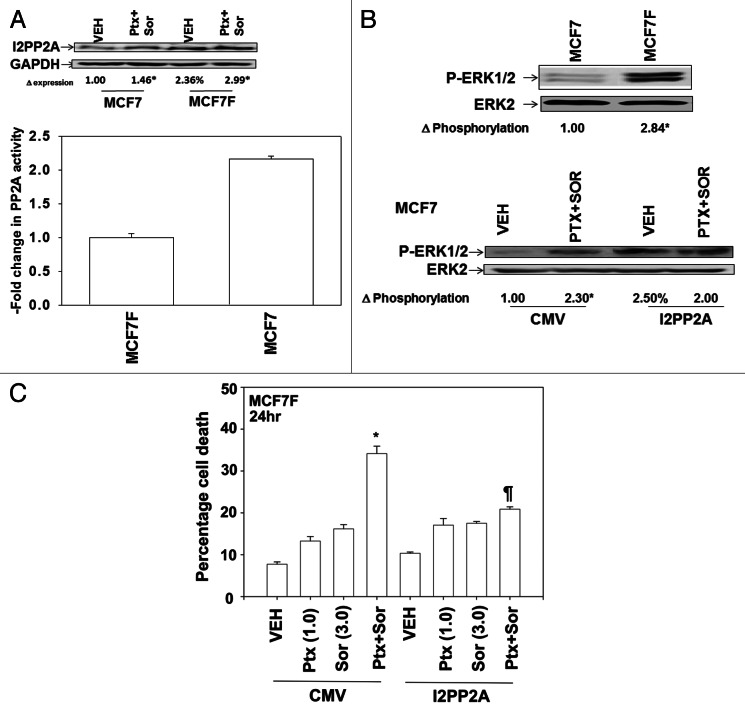
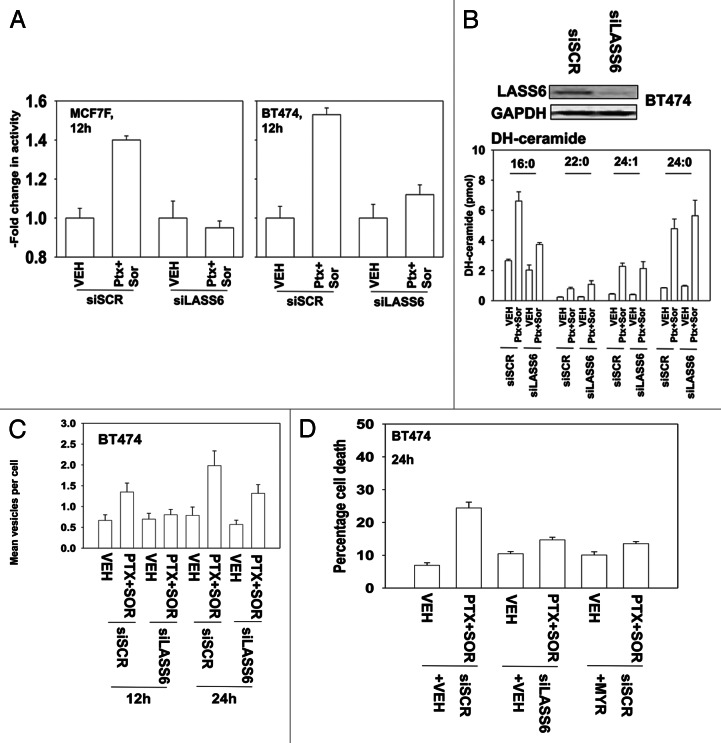
The present studies sought to further understand how the anti-folate pemetrexed and the multi-kinase inhibitor sorafenib interact to kill tumor cells. Sorafenib activated SRC, and via SRC the drug combination activated ERK1/2. Expression of dominant negative SRC or dominant negative MEK1 abolished drug-induced ERK1/2 activation, together with drug-induced autophagy, acidic lysosome formation, and tumor cell killing. Protein phosphatase 2A is an important regulator of the ERK1/2 pathway. Fulvestrant resistant MCF7 cells expressed higher levels of the PP2A inhibitor SET/I2PP2A, had lower endogenous PP2A activity, and had elevated basal ERK1/2 activity compared with their estrogen dependent counterparts. Overexpression of I2PP2A blocked drug-induced activation of ERK1/2 and tumor cell killing. PP2A can be directly activated by ceramide and SET/I2PP2A can be inhibited by ceramide. Inhibition of the de novo ceramide synthase pathway blocked drug-induced ceramide generation, PP2A activation and tumor cell killing. Collectively these findings demonstrate that ERK1/2 plays an essential role downstream of SRC in pemetrexed and sorafenib lethality and that PP2A plays an important role in regulating this process.


Figures

None
Figure 1A-D. Pemetrexed and sorafenib induce autophagy, AVOs, and tumor cell killing that is suppressed by knockdown of Beclin1. (A) BT474 and MCF7F cells were transfected with a plasmid to express LC3-GFP in parallel with scrambled siRNA (siSCR) or to knockdown Beclin1 (siBeclin1). After 24h cells were treated with Vehicle (VEH) or pemetrexed (PTX, 1 μM) and sorafenib (SOR, 3 μM). Twenty-four h later cells were examined under a fluorescent microscope. The mean number of LC3-GFP vesicles per cell was determined (n = 3, ± SEM) # p < 0.05 less than corresponding value in CMV transfected cells. (B) BT474 and MCF7F cells were treated with Vehicle (VEH) or pemetrexed (PTX, 1 μM) and sorafenib (SOR, 3 μM) and 6h-24h later portions of cells were treated with lysotracker red to visualize acidic endosomes (AVOs). Images are a representative (n = 3). Upper blot: MCF7F cells were treated with Vehicle (VEH) or pemetrexed (PTX, 1 μM) and sorafenib (SOR, 3 μM). Cells were isolated 12h later and immunoblotting performed for LC3-II and p62. (C) MCF7F cells were transfected with scrambled siRNA (siSCR) or to knockdown Beclin1. After 24h cells were treated with Vehicle (VEH) or pemetrexed (PTX, 1 μM) and sorafenib (SOR, 3 μM). Six h and 24h later portions of cells were treated with lysotracker red. Images are representative (n = 3). (D) BT474 cells were transfected with scrambled siRNA (siSCR) or to knockdown Beclin1. Twenty-four h later cells were treated with Vehicle (VEH) or pemetrexed (PTX, 1 μM) and sorafenib (SOR, 3 μM). Six h and 24h later portions of cells were treated with lysotracker red. Images are representative (n = 3).
<b>Figure 1E</b>.
Figure 1E.
BT474 and MCF7F cells were transfected to knockdown Beclin1 were treated with Vehicle (VEH) or pemetrexed (PTX, 1 μM) and sorafenib (SOR, 3 μM). Cells were isolated 24h later and viability determined by trypan blue exclusion (n = 3, ± SEM) # p < 0.05 less than corresponding value in CMV transfected cells.
None
Figure 2. SRC signaling plays an essential role in pemetrexed and sorafenib toxicity. (A) and (B) BT474 and MCF7F cells were transfected to express LC3-GFP and with either empty vector (CMV) or with a plasmid to express dominant negative SRC (dnSRC). After 24h cells were treated with Vehicle (VEH) or pemetrexed (PTX, 1 μM) and sorafenib (SOR, 3 μM), and 6h and 24h later cells were examined under a fluorescent microscope. The mean number of LC3-GFP vesicles per cell was determined (n = 3, ± SEM) # p < 0.05 less than corresponding value in CMV transfected cells. Upper panels: Knockdown of PDGFRβ increases SRC Y416 phosphorylation; increased total expression of c-SRC in cells expressing dominant negative c-SRC. (C) MCF7F and BT474 cells were transfected with either empty vector (CMV) or with a plasmid to express dominant negative SRC. After 24h cells were treated with Vehicle (VEH) or pemetrexed (PTX, 1 μM) and sorafenib (SOR, 3 μM). Cells were isolated 24h later and viability determined by trypan blue exclusion (n = 3, ± SEM) # p < 0.05 less than corresponding value in CMV transfected cells.
None
Figure 3. SRC-MEK signaling promotes drug combination cell killing. (A) MCF7F cells were transfected with either empty vector (CMV) or with a plasmid to express dominant negative SRC. After 24h cells were treated with Vehicle (VEH) or pemetrexed (PTX, 1 μM) and sorafenib (SOR, 3 μM). Cells were isolated 24h later and the levels of ERK1/2 phosphorylation determined (n = 3). (B) MCF7, MCF7F and BT474 cells were infected with either empty vector (CMV) virus or with a virus to express dominant negative MEK1. After 24h cells were treated with Vehicle (VEH) or pemetrexed (PTX, 1 μM) and sorafenib (SOR, 3 μM). Cells were isolated 24h later and viability determined by trypan blue exclusion (n = 3, ± SEM) # p < 0.05 less than corresponding value in CMV transfected cells. (C) MCF7F cells were transfected to express LC3-GFP and infected with either empty vector (CMV) virus or with a virus to express dominant negative MEK1. After 24h cells were treated with Vehicle (VEH) or pemetrexed (PTX, 1 μM) and sorafenib (SOR, 3 μM). Cells were examined 12h later under a fluorescent microscope. The mean number of LC3-GFP vesicles per cell was determined (n = 3, ± SEM) # p < 0.05 differential value than corresponding value in CMV transfected cells. (D) MCF7F and BT474 cells were infected with either empty vector (CMV) virus or with a virus to express dominant negative MEK1. After 24h cells were treated with Vehicle (VEH) or pemetrexed (PTX, 1 μM) and sorafenib (SOR, 3 μM). Twenty-four h later portions of cells were treated with lysotracker red. Images are representative (n = 3).
None
Figure 4. SET/I2PP2A modulates the response of cells to pemetrexed and sorafenib exposure. (A) MCF7 and MCF7F cells were isolated and PP2A activity determined. Upper blot: MCF7 and MCF7F cells were treated with Vehicle (VEH) or pemetrexed (PTX, 1 μM) and sorafenib (SOR, 3 μM). Cells were isolated 24 h later and the expression of I2PP2A determined. Changes in expression were normalized to GAPDH levels and presented as the –Fold change in I2PP2A levels (n = 3 ± SEM). * p < 0.05 greater than corresponding vehicle control; % p < 0.05 greater than corresponding value in MCF7 cells. (B) Upper blot: MCF7 and MCF7F cells were isolated and immunoblotting performed to determine the phosphorylation of ERK1/2. Changes in P-ERK1/2 levels were normalized to total ERK2 and presented as the –Fold change in P-ERK1/2 levels (n = 3 ± SEM). Lower blot: MCF7F cells were transfected with empty vector control (CMV) or a plasmid to express I2PP2A. Twenty-four h later cells were treated with Vehicle (VEH) or pemetrexed (PTX, 1 μM) and sorafenib (SOR, 3 μM). Cells were isolated 24h later and the phosphorylation of ERK1/2 determined. Changes in levels were normalized to total ERK2 levels and presented as the -fold change in P-ERK1/2 levels (n = 3 ± SEM). * p < 0.05 greater than corresponding vehicle control; % p < 0.05 greater than corresponding value in vector control cells. (C) MCF7F cells were transfected with either an empty vector control (CMV) or plasmid to express I2PP2A. Twenty-four h later cells were treated with Vehicle (VEH), pemetrexed (PTX, 1 μM) and/or sorafenib (SOR, 3 μM). Cells were isolated 24h later and viability determined by trypan blue exclusion (n = 3, ± SEM).
None
Figure 5. Ceramide-dependent regulation of PP2A function plays an important role in the toxicity of pemetrexed and sorafenib treatment. (A) MCF7F and BT474 cells were transfected with scrambled siRNA or an siRNA to knockdown LASS6 expression. Twenty-four h later cells were treated with Vehicle (VEH) or pemetrexed (PTX, 1 μM) and sorafenib (SOR, 3 μM). Cells were isolated 24 h later and PP2A activity determined. Data are normalized, with vehicle control + vector control cell PP2A activity equal to 1.00 (n = 3 ± SEM). (B) BT474 cells were transfected with a scrambled siRNA or an siRNA to knockdown LASS6 expression. Twenty-four h later cells were treated with Vehicle (VEH) or pemetrexed (PTX, 1 μM) and sorafenib (SOR, 3 μM). Cells were isolated after 12 h and prepared for mass spectrometric assessment of dihydro (DH)-ceramide levels as described in Methods (n = 2, 6 independent samples total, ± SEM). (C) BT474 cells were transfected to express LC3-GFP and with siRNA scrambled or to knockdown LASS6 expression. Twenty-four h later cells were treated with Vehicle (VEH) or pemetrexed (PTX, 1 μM) and sorafenib (SOR, 3 μM). Twelve h and 24h later cells were examined under a fluorescent microscope. The mean number of LC3-GFP vesicles per cell was determined (n = 3, ± SEM). (D) BT474 cells were transfected with scrambled siRNA or an siRNA to knockdown LASS6 expression. Twenty-four h later cells were treated with vehicle or myriocin (MYR, 1 μM), as indicated. Thirty minutes later cells were treated with Vehicle (VEH) or pemetrexed (PTX, 1 μM) and sorafenib (SOR, 3 μM). Cells were isolated 24h later and viability determined by trypan blue exclusion (n = 3, ± SEM).

Similar articles

Cited by

References

    1. Gottesman MM. Mechanisms of cancer drug resistance. Annu Rev Med. 2002;53:615–27. doi: 10.1146/annurev.med.53.082901.103929. - DOI - PubMed
    1. Hyer ML, Samuel T, Reed JC. The FLIP-side of Fas signaling. Clin Cancer Res. 2006;12:5929–31. doi: 10.1158/1078-0432.CCR-06-2098. - DOI - PubMed
    1. Grinberg M, Sarig R, Zaltsman Y, Frumkin D. Grammatikakis N, Reuvany E, Gross A. tBid homo-oligomerizes in the mitochondrial membrane to induce apoptosis. J Biol Chem. 2002;277:12237–45. doi: 10.1074/jbc.M104893200. - DOI - PubMed
    1. Esposti MD. The roles of Bid. Apoptosis. 2002;7:433–40. doi: 10.1023/A:1020035124855. - DOI - PubMed
    1. Korsmeyer SJ, Wei MC, Saito M, Weiler S, Oh KJ, Schlesinger PH. Pro-apoptotic cascade activates BID, which oligomerizes BAK or BAX into pores that result in the release of cytochrome c. Cell Death Differ. 2000;7:1166–73. doi: 10.1038/sj.cdd.4400783. - DOI - PubMed

Publication types

MeSH terms

LinkOut - more resources