. 2012 Jun 6;32(23):7852-61.
doi: 10.1523/JNEUROSCI.5901-11.2012.

Neurotoxicity and memory deficits induced by soluble low-molecular-weight amyloid-β1-42 oligomers are revealed in vivo by using a novel animal model

Affiliations

Neurotoxicity and memory deficits induced by soluble low-molecular-weight amyloid-β1-42 oligomers are revealed in vivo by using a novel animal model

Jonathan Brouillette et al. J Neurosci. .

Abstract

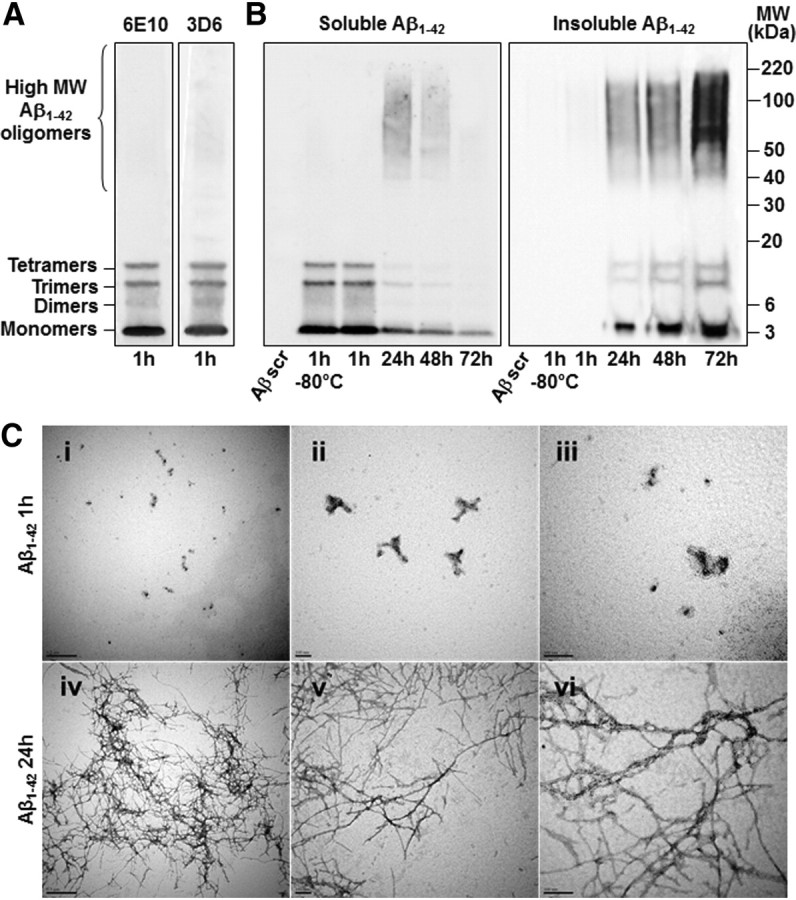
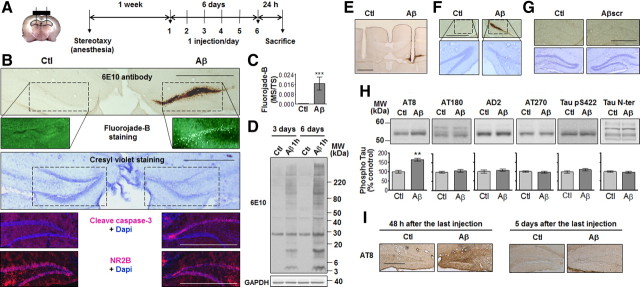
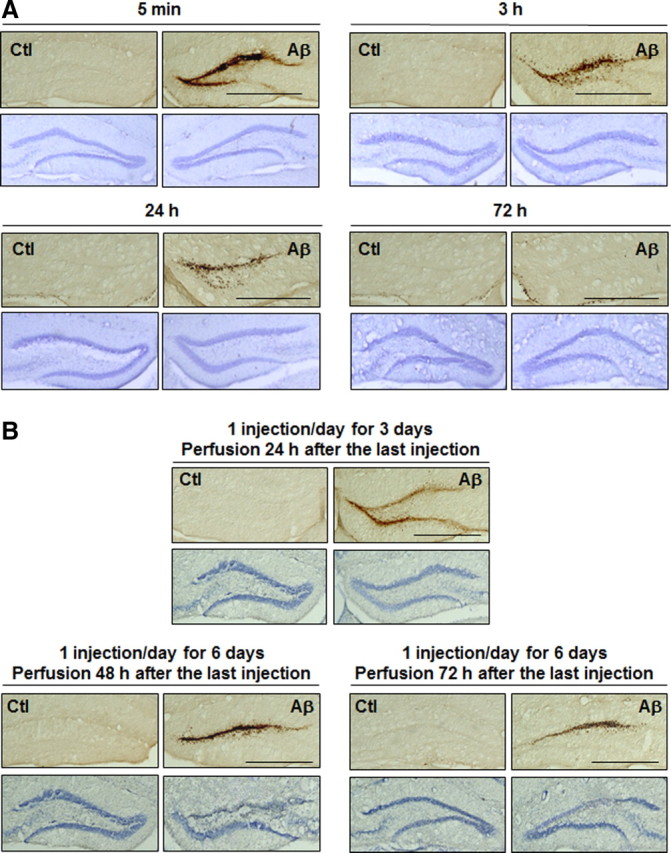
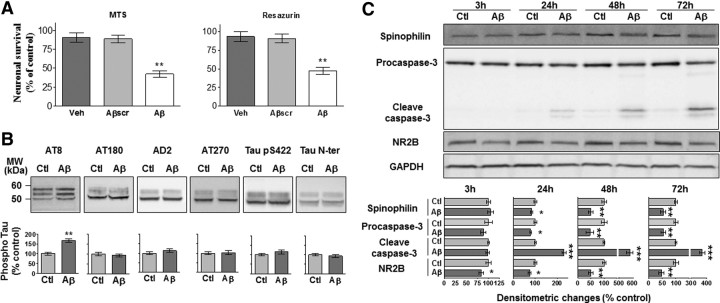
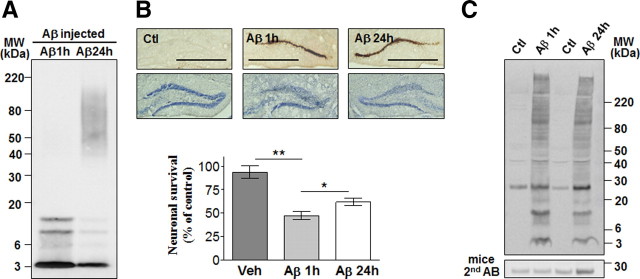
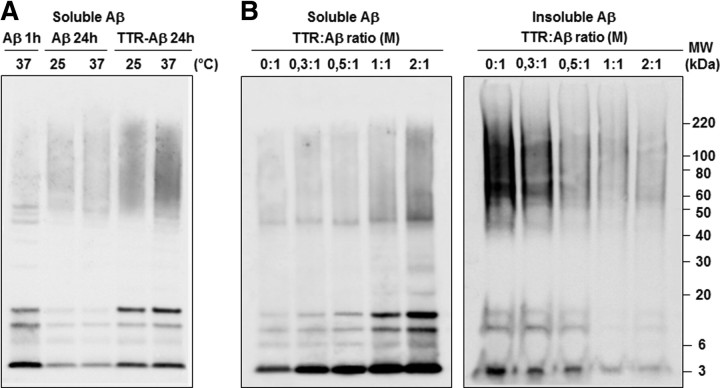
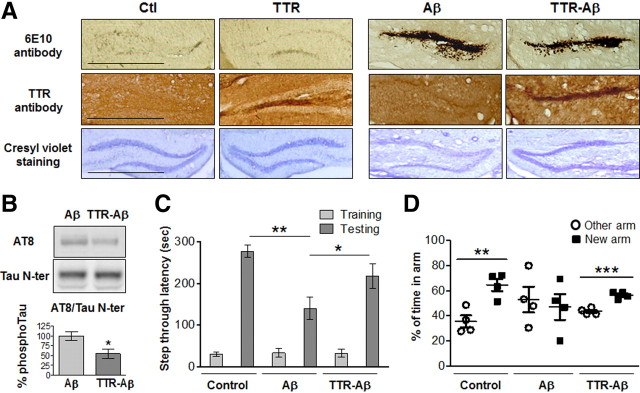
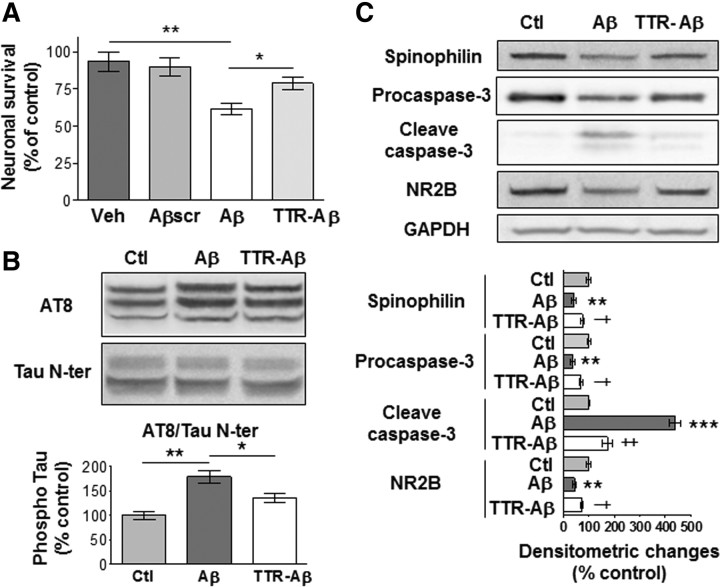
Neuronal and synaptic degeneration are the best pathological correlates for memory decline in Alzheimer's disease (AD). Although the accumulation of soluble low-molecular-weight amyloid-β (Aβ) oligomers has been suggested to trigger neurodegeneration in AD, animal models overexpressing or infused with Aβ lack neuronal loss at the onset of memory deficits. Using a novel in vivo approach, we found that repeated hippocampal injections of small soluble Aβ(1-42) oligomers in awake, freely moving mice were able to induce marked neuronal loss, tau hyperphosphorylation, and deficits in hippocampus-dependent memory. The neurotoxicity of small Aβ(1-42) species was observed in vivo as well as in vitro in association with increased caspase-3 activity and reduced levels of the NMDA receptor subunit NR2B. We found that the sequestering agent transthyretin is able to bind the toxic Aβ(1-42) species and attenuated the loss of neurons and memory deficits. Our novel mouse model provides evidence that small, soluble Aβ(1-42) oligomers are able to induce extensive neuronal loss in vivo and initiate a cascade of events that mimic the key neuropathological hallmarks of AD.


Figures

Figure 1.
Figure 1.
General profiles of Aβ1–42 oligomers injected in vivo and oligomerization of Aβ1–42 over time. A, Representative immunoblot of the Aβ1–42 solution used in our mouse model. The Aβ1–42 preparation is kept at 25°C for 1 h before administration and is almost exclusively composed of low-molecular-weight Aβ1–42 oligomers as revealed by electrophoresis on an SDS-NuPAGE Novex 4–12% Bis-Tris gel system using the Aβ antibodies 6E10 and 3D6. B, Representative 6E10-immunoblots of Aβ1–42 oligomerization. Soluble Aβ1–42 forms higher molecular weight (MW) oligomers over time and its concentration decreases in favor of insoluble Aβ1–42 species, which were recovered from the side of low-adhesion tubes with formic acid treatment. Scrambled Aβ1–42 (Aβscr) is not recognized by the 6E10 antibody (n = 3 for each gel in 3 independent experiments). C, The Aβ1–42 solution was verified in nondenaturing condition by TEM 1 h (i–iii) and 24 h (iv–vi) after preparation (i and iv, ×30000, scale bars 0, 5 μm; ii and v, ×85000, scale bars 0, 1 μm; iii and vi, ×140000, scale bars 0, 1 μm).
Figure 2.
Figure 2.
Neuronal deaths induced by Aβ1–42-oligomer deposition and tau phosphorylation following repeated intrahippocampal injections. A, Bilateral cannulae were stereotaxically implanted in the DG. One week following surgery, Aβ1–42 oligomers (Aβ; 0.2 μg/μl; 2 μl) and vehicle (Ctl) were simultaneously injected collaterally in awake, freely moving mice once a day for 6 consecutive days and killed 24 h following the last injection. B, Representative accumulation of Aβ1–42 oligomers in the DG on a section immediately next to the cannulae insertion site. Bottom, Representative staining with Fluoro-Jade B, cresyl violet, cleaved caspase-3 antibody, and NR2B antibody. C, Quantification of Fluoro-Jade B staining within the DG 24 h following the last injection. Marked surface (MS) versus total surface (TS) counted (n = 4, ***p < 0.001). D, Representative immunoblots of Aβ1–42 oligomer profiles 24 h following the last injection. E, Representative 6E10-immunostained section showing cannulae insertion. F, Representative accumulation of Aβ1–42 oligomers and cell death when the Aβ1–42 preparation is injected in the more ventral part of the hippocampus (−3.4 mm AP, ±2.0 mm ML, −2.4 mm DV from bregma) in sections stained with the 6E10 antibody and cresyl violet. G, Representative DG sections stained with 6E10 antibody and cresyl violet following collateral injections (1 per day for 6 d) of vehicle (Ctl) and scrambled Aβ1–42 (Aβscr; 0.2 μg/μl; 2 μl). H, Representative immunoblots of tau phosphorylation in the dorsal hippocampus of mice injected collaterally with vehicle (Ctl) and Aβ1–42 oligomers for 6 d. Bottom, Densitometric quantification of changes expressed as the mean ratio of phospho-tau to total tau antibody (Tau N-ter) staining. Error bars indicate ± SEM. **p < 0.01. I, Representative AT8-immunostained section 24 h and 5 d after the last injection (n = 4, two independent experiments). Scale bars: 50 μm.
Figure 3.
Figure 3.
Time-dependent deposition of Aβ1–42 oligomers and neuronal death. Representative DG sections following single (A) or multiple (B) injections of Aβ1–42 oligomers (Aβ) and vehicle (Ctl) at the time points indicated and stained with the 6E10 antibody and cresyl violet. Scale bars: 50 μm (n = 4 for each time point, two independent experiments).
Figure 4.
Figure 4.
Neurotoxicity induced by soluble Aβ1–42 oligomers in primary hippocampal culture is accompanied by tau phosphorylation, increased caspase-3 activity, and decreased levels of spinophilin and NR2B subunit. A, MTS and resazurin assays following 72 h treatment with vehicle (Veh), 2 μm of scrambled Aβ1–42 oligomers (Aβscr), or 2 μm of soluble Aβ1–42 oligomers (Aβ) kept at 25°C for 1 h before administration. The histograms are mean values expressed as a percentage of control (cultures without any treatment). B, C, Representative immunoblots of tau phosphorylation (B) as well as spinophilin, procaspase-3 and cleaved caspase-3, NR2B, and GAPDH (C) from neurons treated with vehicle (Ctl) or soluble Aβ1–42 oligomers (2 μm). For tau phosphorylation, densitometric quantification of changes is expressed as the mean ratio of phospho-tau to total tau antibody (Tau N-ter) staining. Results are all expressed normalized to GAPDH. Error bars indicate SEM. *p < 0.05, **p < 0.01, ***p < 0.001 (3 independent experiments performed in duplicate).
Figure 5.
Figure 5.
Neurotoxicity induced by soluble Aβ1–42 oligomers prepared 1 or 24 h before administration. A, Profiles of Aβ1–42 oligomers kept at 25°C for 1 h (Aβ 1 h) or 37°C for 24 h (Aβ 24 h) before administration. B, Representative DG sections 24 h following the last injection (6 injections, 1 per day) of Aβ1–42 oligomers (1 and 24 h; 0.2 μg/μl; 2 μl) or vehicle (Ctl) stained with the 6E10 antibody and cresyl violet. Scale bars: 50 μm (n = 4, two independent experiments). Bottom, Resazurin assays on neuronal cultures treated with vehicle (Veh) or 2 μm of Aβ 1 h or Aβ 24 h. Histograms show mean values expressed as a percentage of controls (cultures without any treatment) ± SEM. *p < 0.05, **p < 0.01 (3 independent experiments performed in duplicate). C, Hippocampal Aβ1–42 oligomer profiles 24 h following the last injection (6 injections, 1 per day) using the 6E10 antibody. Bottom, The membrane was incubated with the anti-mouse secondary antibody (AB) without the 6E10 primary mouse monoclonal antibody (n = 4, two independent experiments).
Figure 6.
Figure 6.
Sequestration of soluble Aβ1–42 oligomers with TTR. A, Representative 6E10-immunoblot of soluble Aβ1–42 oligomers 1 or 24 h following Aβ1–42 preparation with TTR (TTR-Aβ, molar (M) ratio of 2:1) or Aβ1–42 alone (Aβ) at the temperature indicated. B, Increasing doses of TTR mixed with Aβ1–42 at 37°C during 24 h promoted the sequestration and retrieval of soluble Aβ1–42 oligomers on an SDS-NuPAGE gel system using the 6E10 antibody. Lower levels of insoluble Aβ1–42 stuck to the side of low-adhesion tubes were recovered with formic acid treatment while increasing the TTR concentration in Aβ1–42 solutions (right blot) (n = 3 for each gel, 3 independent experiments).
Figure 7.
Figure 7.
Neuronal death, tau phosphorylation, and memory deficits induced by Aβ1–42 oligomers are attenuated by TTR. A, Representative DG section 24 h after the last injection (1 per day during 6 d) with Aβ1–42 oligomers alone (0.2 μg/μl, 2 μl) or with TTR (TTR-Aβ, molar ratio of 2:1), TTR alone, or vehicle (Ctl), kept at 37°C for 24 h before administration. Scale bars: 50 μm. B, Representative immunoblots of hippocampal tau phosphorylation in mice injected collaterally with Aβ1–42 oligomers and TTR-Aβ. Densitometric quantification of changes is expressed as the mean ratio of AT8 antibody to total Tau N-ter. Error bars indicate ± SEM. *p < 0.05 (n = 4, 2 independent experiments). C, D, Mice bilaterally injected in the DG with control vehicle, Aβ1–42 oligomers, or TTR-Aβ were tested in the passive avoidance memory task (C) and the Y maze (D). During the passive avoidance conditioning, latency of entry into the dark compartment was evaluated during the training phase and the testing phase 24 h later. For the Y maze, we analyzed the percentage of time spent in the arm (other) already explored during the training phase and the new arm available during the testing phase. Values are mean latency ± SEM. *p < 0.05, **p < 0.01, ***p < 0.001 (n = 8 for each experimental group for the passive avoidance task, n = 4 for each experimental group for the Y maze).
Figure 8.
Figure 8.
TTR prevented the deleterious effects of soluble Aβ1–42 oligomers in primary hippocampal cultures. A, Resazurin assays following a 72 h treatment with vehicle (Veh), 2 μm of scramble Aβ1–42 oligomers (Aβscr), or 2 μm of soluble Aβ1–42 oligomers alone (Aβ) or with TTR (TTR-Aβ; molar ratio of 2:1) kept at 37°C for 24 h before administration. B, C, Representative immunoblots of tau phosphorylation (B) as well as spinophilin, caspase-3, NR2B, and GAPDH (C) for neurons treated with vehicle (Ctl), Aβ, or TTR-Aβ (molar ratio of 2:1). For tau phosphorylation, densitometric quantification of changes is expressed as the mean ratio of AT8 to Tau N-ter antibody. The histograms are mean values expressed as a percentage of control ± SEM. * or ** indicates a statistical significant variation between Ctl and Aβ, and † or ‡ indicates a difference between Aβ and TTR-Aβ. *,†p < 0.05, **,‡p < 0.01, ***p < 0.001 (3 independent experiments performed in duplicate).

References

    1. AbdAlla S, Lother H, el Missiry A, Langer A, Sergeev P, el Faramawy Y, Quitterer U. Angiotensin II AT2 receptor oligomers mediate G-protein dysfunction in an animal model of Alzheimer disease. J Biol Chem. 2009;284:6554–6565. - PubMed
    1. Arendt T. Synaptic degeneration in Alzheimer's disease. Acta Neuropathol. 2009;118:167–179. - PubMed
    1. Benilova I, Karran E, De Strooper B. The toxic Aβ oligomer and Alzheimer's disease: an emperor in need of clothes. Nat Neurosci. 2012;15:349–357. - PubMed
    1. Bianchi SL, Tran T, Liu C, Lin S, Li Y, Keller JM, Eckenhoff RG, Eckenhoff MF. Brain and behavior changes in 12-month-old Tg2576 and nontransgenic mice exposed to anesthetics. Neurobiol Aging. 2008;29:1002–1010. - PMC - PubMed
    1. Broersen K, Jonckheere W, Rozenski J, Vandersteen A, Pauwels K, Pastore A, Rousseau F, Schymkowitz J. A standardized and biocompatible preparation of aggregate-free amyloid beta peptide for biophysical and biological studies of Alzheimer's disease. Protein Eng Des Sel. 2011;24:743–750. - PubMed

Publication types

MeSH terms