. 2012 Jun 6;32(23):7869-80.
doi: 10.1523/JNEUROSCI.0943-12.2012.

State-dependent spike and local field synchronization between motor cortex and substantia nigra in hemiparkinsonian rats

Affiliations

State-dependent spike and local field synchronization between motor cortex and substantia nigra in hemiparkinsonian rats

Elena Brazhnik et al. J Neurosci. .

Abstract

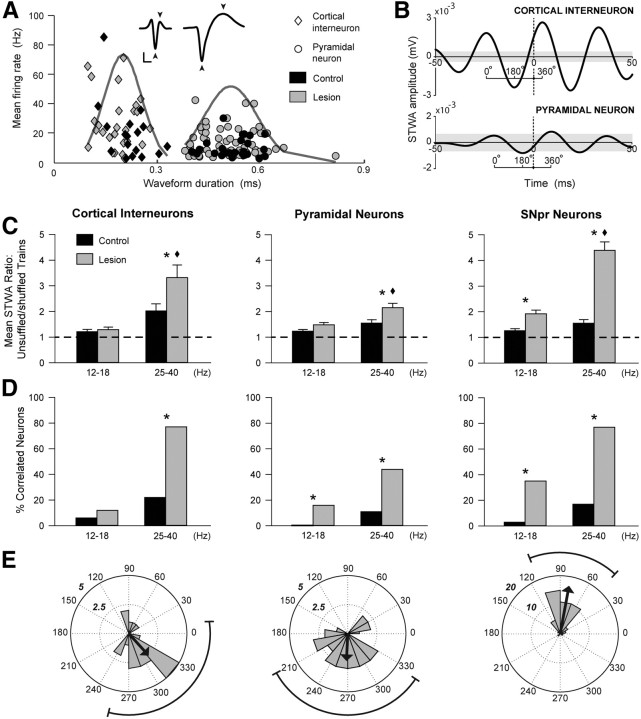
Excessive beta frequency oscillatory and synchronized activity has been reported in the basal ganglia of parkinsonian patients and animal models of the disease. To gain insight into processes underlying this activity, this study explores relationships between oscillatory activity in motor cortex and basal ganglia output in behaving rats after dopamine cell lesion. During inattentive rest, 7 d after lesion, increases in motor cortex-substantia nigra pars reticulata (SNpr) coherence emerged in the 8-25 Hz range, with significant increases in local field potential (LFP) power in SNpr but not motor cortex. In contrast, during treadmill walking, marked increases in both motor cortex and SNpr LFP power, as well as coherence, emerged in the 25-40 Hz band with a peak frequency at 30-35 Hz. Spike-triggered waveform averages showed that 77% of SNpr neurons, 77% of putative cortical interneurons, and 44% of putative pyramidal neurons were significantly phase-locked to the increased cortical LFP activity in the 25-40 Hz range. Although the mean lag between cortical and SNpr LFPs fluctuated around zero, SNpr neurons phase-locked to cortical LFP oscillations fired, on average, 17 ms after synchronized spiking in motor cortex. High coherence between LFP oscillations in cortex and SNpr supports the view that cortical activity facilitates entrainment and synchronization of activity in basal ganglia after loss of dopamine. However, the dramatic increases in cortical power and relative timing of phase-locked spiking in these areas suggest that additional processes help shape the frequency-specific tuning of the basal ganglia-thalamocortical network during ongoing motor activity.


Figures

Figure 1.
Figure 1.
Power and coherence of motor cortex and SNpr LFP activity in the dopamine-cell-lesioned hemisphere and in intact rats during rest and treadmill walking. A–F, Representative wavelet-based scalograms represent the time–frequency plots of LFP spectral power in the motor cortex (A, B) and SNpr (C, D) during inattentive rest, adjustment as the treadmill is started, and treadmill walking. Spectral power was plotted on a logarithmic scale with greater power being represented by red colors. FFT-based spectrograms (E, F) show coherence between motor cortex and SNpr over the same time interval. Note the emergence of high beta/low gamma (30–35 Hz) frequency oscillations and increased coherence between the motor cortex and SNpr LFP activity at the transition from rest to walk in the dopamine-cell-lesioned hemisphere. A modest, more diffused band is present in the 40–50 Hz range in the motor cortex of the control rats during treadmill walking. G–L, Bar graphs represent mean total LFP power in the motor cortex (G, H) and SNpr (I, J) and motor cortex–SNpr coherence (K, L) within a series of frequency ranges: alpha (8–12 Hz), low beta (12–18 Hz and 19–25 Hz), high beta/low gamma (25–40 Hz), and gamma (40–50 Hz) in intact rats (N = 8) and day 7 postlesion in dopamine-cell-lesioned hemispheres (N = 10). Linear graphs show averaged LFP power spectra and motor cortex–SNpr coherence from 8 to 60 Hz for the same rest and walking epochs from the intact hemisphere (black) and from lesioned hemispheres at day 7 postlesion (red), and for day 21 postlesion (green, N = 8). The insert in G shows the same averaged cortical LFP power spectra with an expanded y-axis. During inattentive rest, SNpr power and motor cortex–SNpr coherence are increased in frequencies between 8 and 25 Hz and 8 and 40 Hz, respectively, while walking epochs are characterized by increased coherence and power in both motor cortex and SNpr specifically in the 25–40 Hz frequency range. *Significant difference between intact and lesion hemispheres.
Figure 2.
Figure 2.
Mean frequency of the significant peaks in motor cortex and SNpr power and in motor cortex–SNpr coherence in dopamine-lesioned rats at day 7 and day 21 postlesion during walking. The scatter plot also shows the mean frequency peak of LFP power in intact motor cortex (no peak was observed in the SNpr). Only the set of lesioned animals with data from both day 7 and day 21 were considered (N = 8). Note that the mean frequency of significant peaks in motor cortex power and motor cortex–SNpr coherence in the 30–35 Hz range during walking is significantly increased between the 7th and 21st days postlesion. +Significant difference from day 7 (two-way RM ANOVA, p < 0.05).
Figure 3.
Figure 3.
The effect of l-dopa treatment on LFP oscillatory activity in the motor cortex (MCx) and SNpr in the lesioned hemisphere during walking. A–C, Linear plots of averaged power spectra and motor cortex–SNpr coherence and wavelet-based scalograms of LFP spectral power in the motor cortex (A) and SNpr (B) and their FFT-based coherence (C) represent recordings during treadmill walking in baseline (red line), 30 min after administration of l-dopa (blue line), and 10–20 min following blockade of D2 receptors by eticlopride (0.2 mg/kg, i.p, N = 8; green line). Spectral power was plotted on a logarithmic scale with greater power being represented by red colors. The inserts in the bottom graphs represent the means of total LFP power in the 25–40 Hz frequency range and coherence between 30 and 36 Hz during the same recording epochs. The plots and scalograms indicate that l-dopa treatment significantly reduces motor cortex and SNpr high beta/low gamma synchronization in the lesioned hemisphere during treadmill walking, while the subsequent blockade of D2 receptors restores the motor cortex and SNpr LFP power and coherence in the high beta/low gamma range. *Significant difference in 25–40 Hz power and coherence after l-dopa treatment from baseline walk and from walk after D2 receptor blockade by eticlopride (one-way RM ANOVA, p < 0.001). +Mean frequencies of cortical power and coherence spectral peaks during l-dopa treatment are significantly higher than frequencies of spectral peaks for control and posteticlopride walking at day 21 (one-way RM ANOVA, p < 0.001).
Figure 4.
Figure 4.
Characteristics of the high beta/low gamma frequency coupling of LFP oscillations in the motor cortex and SNpr of control and 6-OHDA-lesioned animals during walk. A, B, Simultaneous LFP recordings from motor cortex and SNpr filtered at 25–40 Hz and overlaid with an outline (red, green) representing the envelope of the power amplitude fluctuations calculated by the Hilbert transform in a control animal (A) and in an animal day 21 postlesion (B). C, D, Estimated direction of coupling between cortex and SNpr for control (N = 8) and lesioned animals on day 7 (N = 8) and day 21 (N = 8); cortex is leading SNpr when cortex–SNpr lags are positive, and SNpr is leading cortex when lags are negative. The lags in C were calculated as the shift at maximum cross-correlation between the filtered LFP signals and in D as the shift at maximum cross-correlation between LFP envelopes. C, D, Bars show the proportion of positive versus negative lags. E–G, Histograms of the distributions of the motor cortex–SNpr lag durations estimated by LFP cross-correlations for control animals (E) and lesioned animals at day 7 (F) and day 21 (G) postlesion. H, Means and standard deviations of the lag times in E–G, where the circles represent the mean lags of individual animals. I–K, Histograms of the distributions of the motor cortex–SNpr lag durations estimated from the cross-correlations of the envelopes for the same three conditions. Note the different scales in I compared with J and K. L, Means and standard deviations of the lag times in I–K. Note the near-zero mean lag in the lesion animals (0.34 ms at day 7 and −0.08 at day 21) between cortical and SNpr LFPs (F–H). Additionally, the mean lags of the LFP envelopes were significantly lower in the lesioned animals (−138.17 ms at day 7 and −95.37 ms at day 21) than in controls (−378.46 ms). *Statistical significance (p < 0.05).
Figure 5.
Figure 5.
Analysis of spike–LFP relationships in motor cortex and SNpr during treadmill walking. A, Scatter plot shows the distribution of waveform duration (trough to peak; arrowheads; scale: 0.2 mV, 0.2 ms) and firing rate of layer 5/6 cortical neurons recorded from day 7 dopamine-lesioned and control rats for neurons with firing rates ≥2 Hz. Cortical neurons were clustered into two groups based on the distributions of waveform duration (k-means, k = 2), which were classified as interneurons (N = 43) or pyramidal neurons (N = 90). Interneurons and pyramidal neurons waveform distributions were shown to be statistically different both for control and lesioned (two-way ANOVA, p < 0.01). Gray curves illustrate the normal characteristics of the distributions of waveform durations for each cell type (scaled with a factor of 10 for purposes of visualization). B, Representative examples of STWA for cortical interneurons (top) and pyramidal spike trains (bottom) paired with cortical LFPs bandpass filtered at 25–40 Hz, with phase-lock values of 311° and 245°, respectively. The shaded area indicates the range of the mean peak-to-trough amplitude ±3 SD of 20 STWAs—each calculated by pairing the same LFP with a shuffled version of the spike train. When the original unshuffled STWAs peak-to-trough values were outside of this range, spikes were considered significantly phase-locked to LFP. C, Bar graphs show mean ratios between peak to trough amplitudes of the original STWA and the mean of 20 shuffled STWAs for LFPs in the frequency ranges 12–18 and 25–40 Hz for putative cortical pyramidal and interneuronal neurons and SNpr neurons. Dashed line denotes ratio of 1. *Significant difference between control and lesion within a frequency range (p < 0.05); Statistical significance across frequency ranges within lesioned or controls (p < 0.05). D, Bar graphs show the proportion of spike trains significantly phase-locked to locally recorded LFPs in the two frequency ranges. *Proportions of phase-locked spike trains are significantly greater in the dopamine-lesioned hemispheres compared with control for both frequency ranges (χ2, p < 0.05). E, Phase plots show the distributions of phase relationships between spikes and cortical LFPs for those spike trains showing significant phase-locking to local LFP in D. Spikes were significantly oriented to high beta/low gamma LFP cortical oscillations for interneurons, pyramidal neurons, and SNpr neurons (Rayleigh, p < 0.005). Arrows reflect a measure of the strength of concentration of the distribution of the mean phase values from spike trains in D, normalized to the radius of the circular plot.

Similar articles

Cited by

References

    1. Adhikari A, Topiwala MA, Gordon JA. Synchronized activity between the ventral hippocampus and the medial prefrontal cortex during anxiety. Neuron. 2010;65:257–269. - PMC - PubMed
    1. Albin RL, Young AB, Penney JB. The functional anatomy of basal ganglia disorders. Trends Neurosci. 1989;12:366–375. - PubMed
    1. Alexander GE, Crutcher MD. Functional architecture of basal ganglia circuits: neural substrates of parallel processing. Trends Neurosci. 1990;13:266–271. - PubMed
    1. Alonso-Frech F, Zamarbide I, Alegre M, Rodríguez-Oroz MC, Guridi J, Manrique M, Valencia M, Artieda J, Obeso JA. Slow oscillatory activity and levodopa-induced dyskinesias in Parkinson's disease. Brain. 2006;129:1748–1757. - PubMed
    1. Aravamuthan BR, Bergstrom DA, French RA, Taylor JJ, Parr-Brownlie LC, Walters JR. Altered neuronal activity relationships between the pedunculopontine nucleus and motor cortex in a rodent model of Parkinson's disease. Exp Neurol. 2008;213:268–280. - PMC - PubMed

Publication types

MeSH terms

LinkOut - more resources