

Expression of HLA-B27 causes loss of migratory dendritic cells in a rat model of spondylarthritis
- PMID: 22674414
- PMCID: PMC3553565
- DOI: 10.1002/art.34561
Expression of HLA-B27 causes loss of migratory dendritic cells in a rat model of spondylarthritis
Abstract
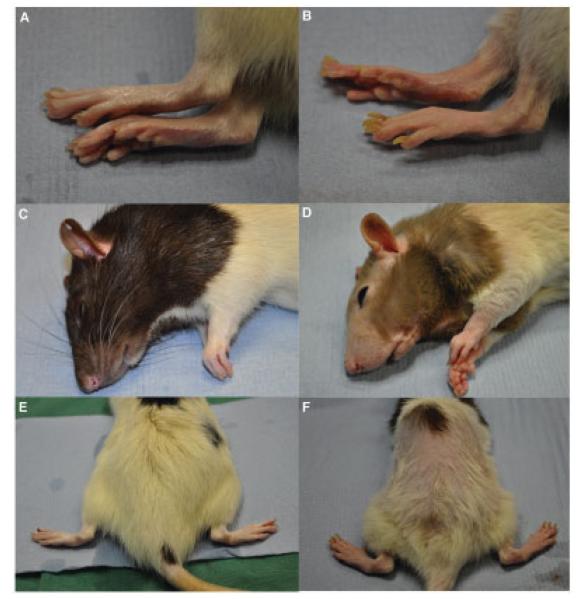
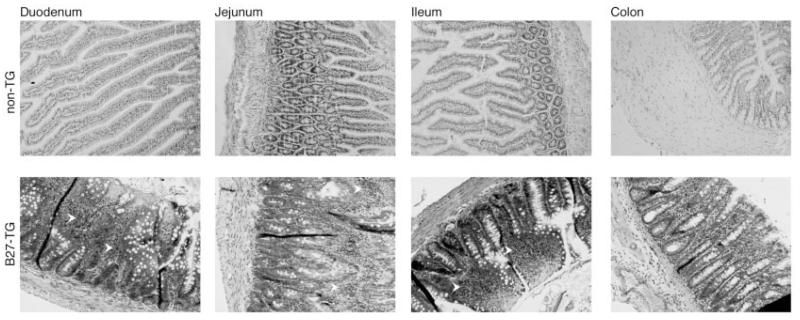
Objective: In rats transgenic for human HLA-B27 and β(2) -microglobulin (B27-transgenic rats), colitis and peripheral inflammation develop spontaneously. Therefore, B27-transgenic rats provide a model of spondylarthritis. Because inflammation in these rats requires CD4+ T lymphocytes and involves intestinal pathology, we hypothesized that dendritic cells (DCs) that migrate from the intestine and control CD4+ T cell differentiation would be aberrant in B27-transgenic rats.
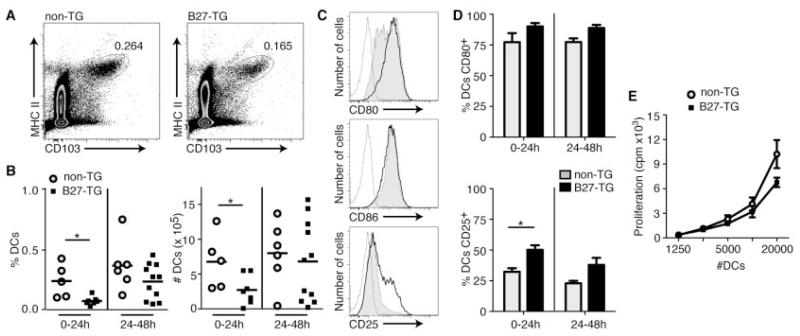
Methods: Migrating intestinal lymph DCs were collected via thoracic duct cannulation from B27-transgenic and control (HLA-B7-transgenic or nontransgenic) rats. The phenotypes of these DCs and of mesenteric lymph node DCs were assessed by flow cytometry. The ability of DCs to differentiate from bone marrow precursors in vitro was also assessed.
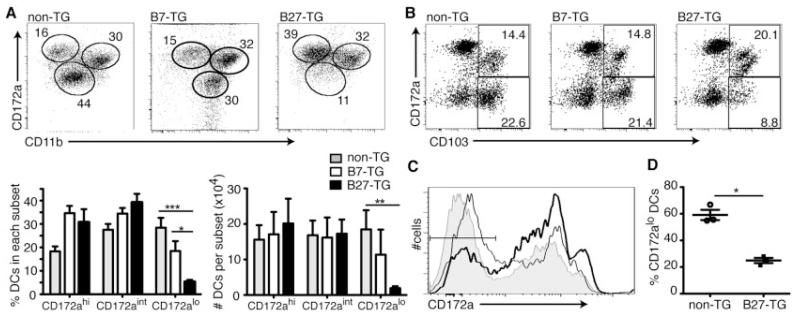
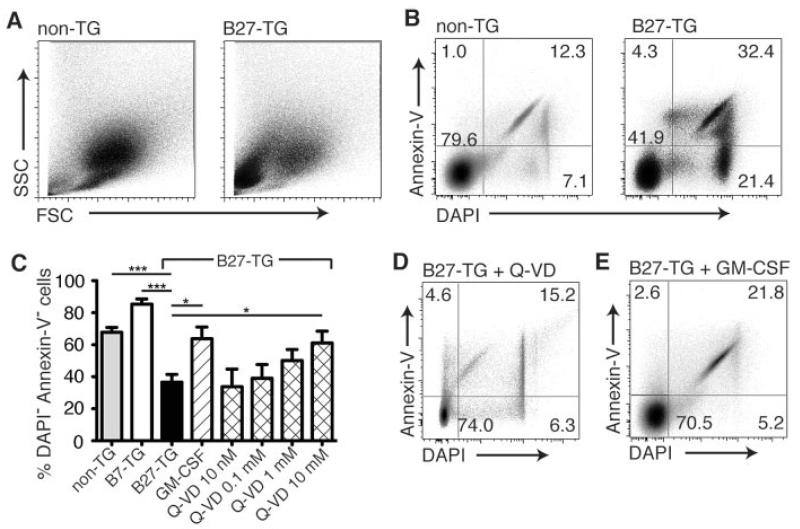
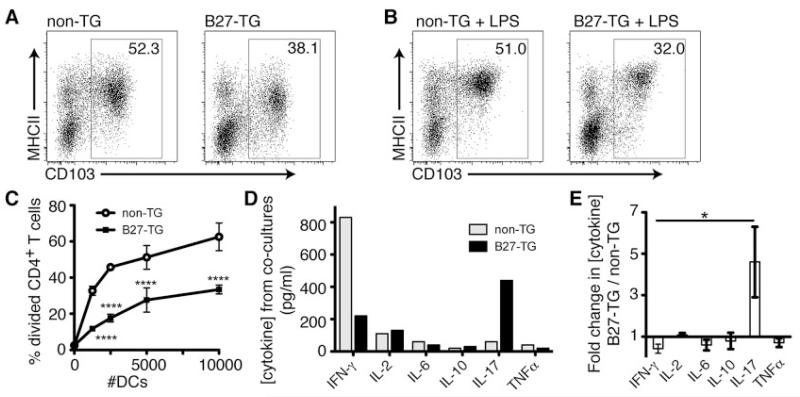
Results: Lymph DCs showed increased activation and, strikingly, lacked the specific DC population that is important for maintaining tolerance to self-antigens. This population of DCs was also depleted from the mesenteric lymph nodes of B27-transgenic rats. Furthermore, in vitro culture of DCs from bone marrow precursors revealed a defect in the ability of B27-transgenic rats to produce DCs of the migratory phenotype, although the DCs that were generated induced enhanced interleukin-17 (IL-17) production from naive CD4+ T cells.
Conclusion: We describe 2 different mechanisms by which HLA-B27 may contribute to inflammatory disease: increased apoptotic death of B27-transgenic DCs that normally function to maintain immunologic tolerance and enhanced IL-17 production from CD4+ T cells stimulated by the surviving B27-transgenic DCs.
Copyright © 2012 by the American College of Rheumatology.
Figures
Similar articles
-
Proinflammatory Th17 cells are expanded and induced by dendritic cells in spondylarthritis-prone HLA-B27-transgenic rats.Arthritis Rheum. 2012 Jan;64(1):110-20. doi: 10.1002/art.33321. Arthritis Rheum. 2012. PMID: 21905004
-
Tolerogenic XCR1+ dendritic cell population is dysregulated in HLA-B27 transgenic rat model of spondyloarthritis.Arthritis Res Ther. 2019 Feb 4;21(1):46. doi: 10.1186/s13075-019-1827-9. Arthritis Res Ther. 2019. PMID: 30717755 Free PMC article.
-
Dendritic cells from spondylarthritis-prone HLA-B27-transgenic rats display altered cytoskeletal dynamics, class II major histocompatibility complex expression, and viability.Arthritis Rheum. 2009 Sep;60(9):2622-32. doi: 10.1002/art.24780. Arthritis Rheum. 2009. PMID: 19714626
-
Dendritic cells in the pathogenesis of ankylosing spondylitis and axial spondyloarthritis.Clin Rheumatol. 2019 May;38(5):1231-1235. doi: 10.1007/s10067-018-4388-4. Epub 2018 Dec 5. Clin Rheumatol. 2019. PMID: 30519775 Review.
-
From HLA-B27 to spondyloarthritis: a journey through the ER.Immunol Rev. 2010 Jan;233(1):181-202. doi: 10.1111/j.0105-2896.2009.00865.x. Immunol Rev. 2010. PMID: 20193000 Free PMC article. Review.
Cited by
-
ERAP1 reduces accumulation of aberrant and disulfide-linked forms of HLA-B27 on the cell surface.Mol Immunol. 2016 Jun;74:10-7. doi: 10.1016/j.molimm.2016.04.002. Epub 2016 Apr 22. Mol Immunol. 2016. PMID: 27107845 Free PMC article.
-
Microbiome dysbiosis in spinal pathology: Mechanisms, evidence, and research limitations.Brain Spine. 2025 May 2;5:104272. doi: 10.1016/j.bas.2025.104272. eCollection 2025. Brain Spine. 2025. PMID: 40476157 Free PMC article. Review.
-
The Early Phases of Ankylosing Spondylitis: Emerging Insights From Clinical and Basic Science.Front Immunol. 2018 Nov 16;9:2668. doi: 10.3389/fimmu.2018.02668. eCollection 2018. Front Immunol. 2018. PMID: 30505307 Free PMC article. Review.
-
Microbiome and mucosal inflammation as extra-articular triggers for rheumatoid arthritis and autoimmunity.Curr Opin Rheumatol. 2014 Jan;26(1):101-7. doi: 10.1097/BOR.0000000000000008. Curr Opin Rheumatol. 2014. PMID: 24247114 Free PMC article. Review.
-
Lessons on SpA pathogenesis from animal models.Semin Immunopathol. 2021 Apr;43(2):207-219. doi: 10.1007/s00281-020-00832-x. Epub 2021 Jan 15. Semin Immunopathol. 2021. PMID: 33449154 Review.
References
-
- Brewerton DA, Hart FD, Nicholls A, Caffrey M, James DC, Sturrock RD. Ankylosing spondylitis and HL-A 27. Lancet. 1973;1:904–7. - PubMed
-
- Hammer RE, Maika SD, Richardson JA, Tang JP, Taurog JD. Spontaneous inflammatory disease in transgenic rats expressing HLA-B27 and human β2m: an animal model of HLA-B27-associated human disorders. Cell. 1990;63:1099–112. - PubMed
-
- Taurog JD, Hammer RE. Experimental spondyloarthropathy in HLA-B27 transgenic rats. Clinical Rheumatol. 1996;15(Suppl 1):22–7. - PubMed
-
- Banchereau J, Steinman RM. Dendritic cells and the control of immunity. Nature. 1998;392:245–52. - PubMed
Publication types
MeSH terms
Substances
Grants and funding
LinkOut - more resources
Full Text Sources
Research Materials
