

Identification of naturally occurring fatty acids of the myelin sheath that resolve neuroinflammation
- PMID: 22674551
- PMCID: PMC3953135
- DOI: 10.1126/scitranslmed.3003831
Identification of naturally occurring fatty acids of the myelin sheath that resolve neuroinflammation
Abstract
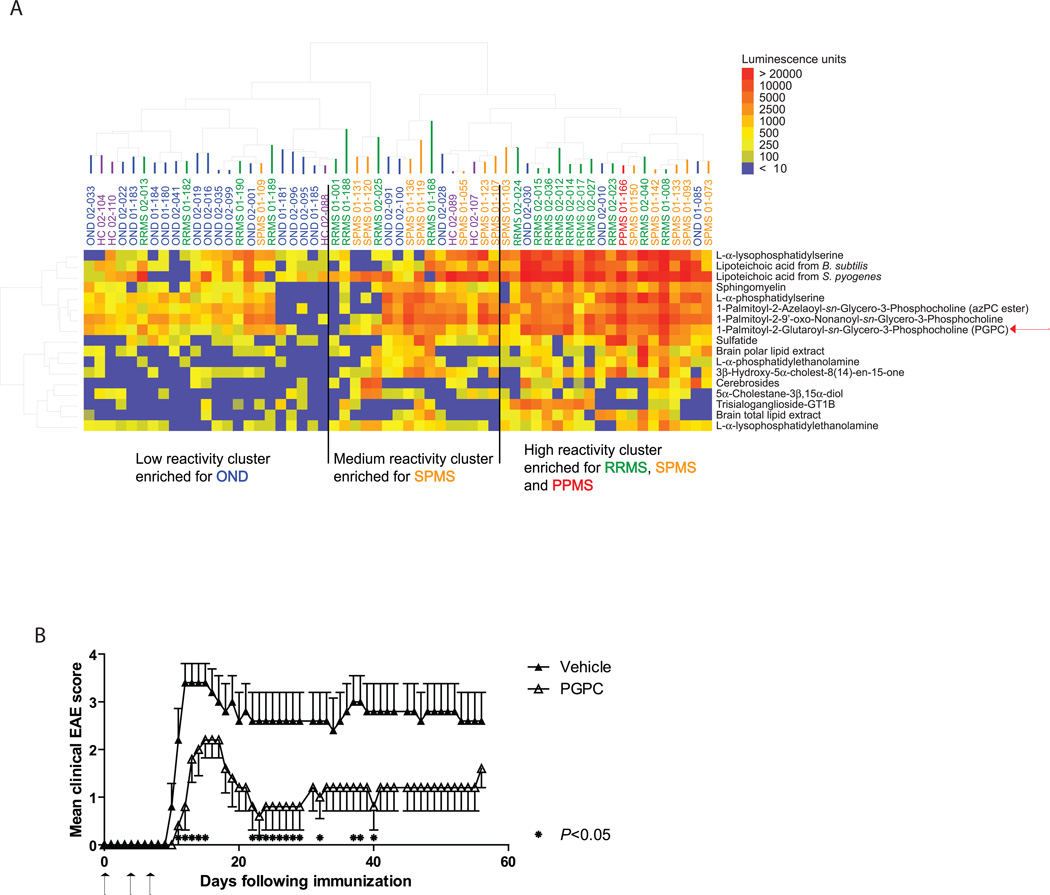
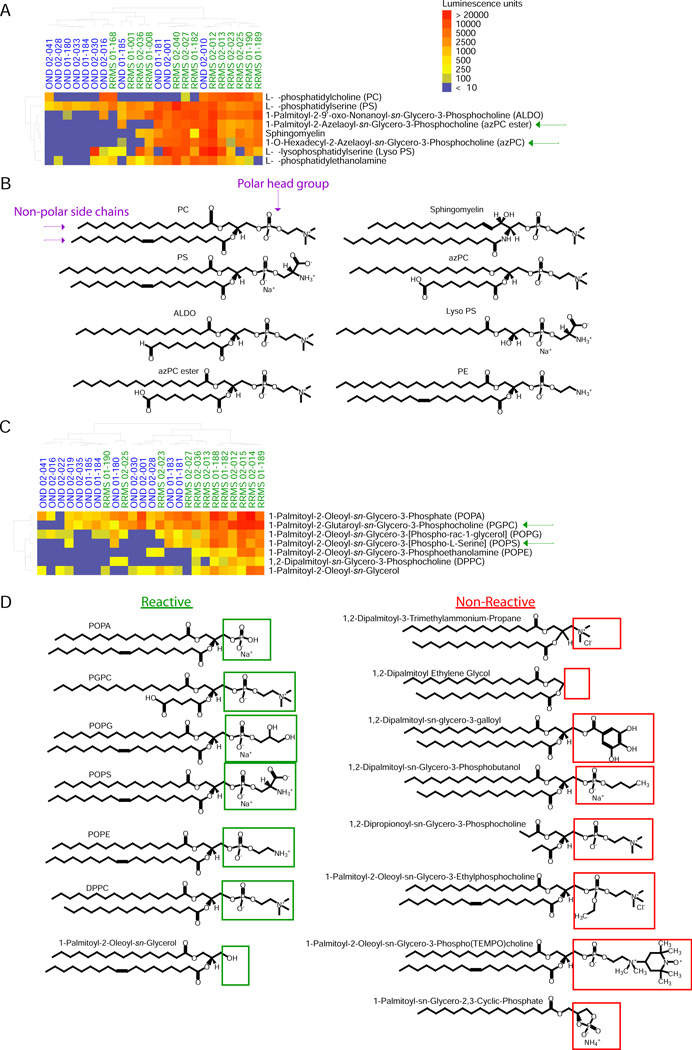
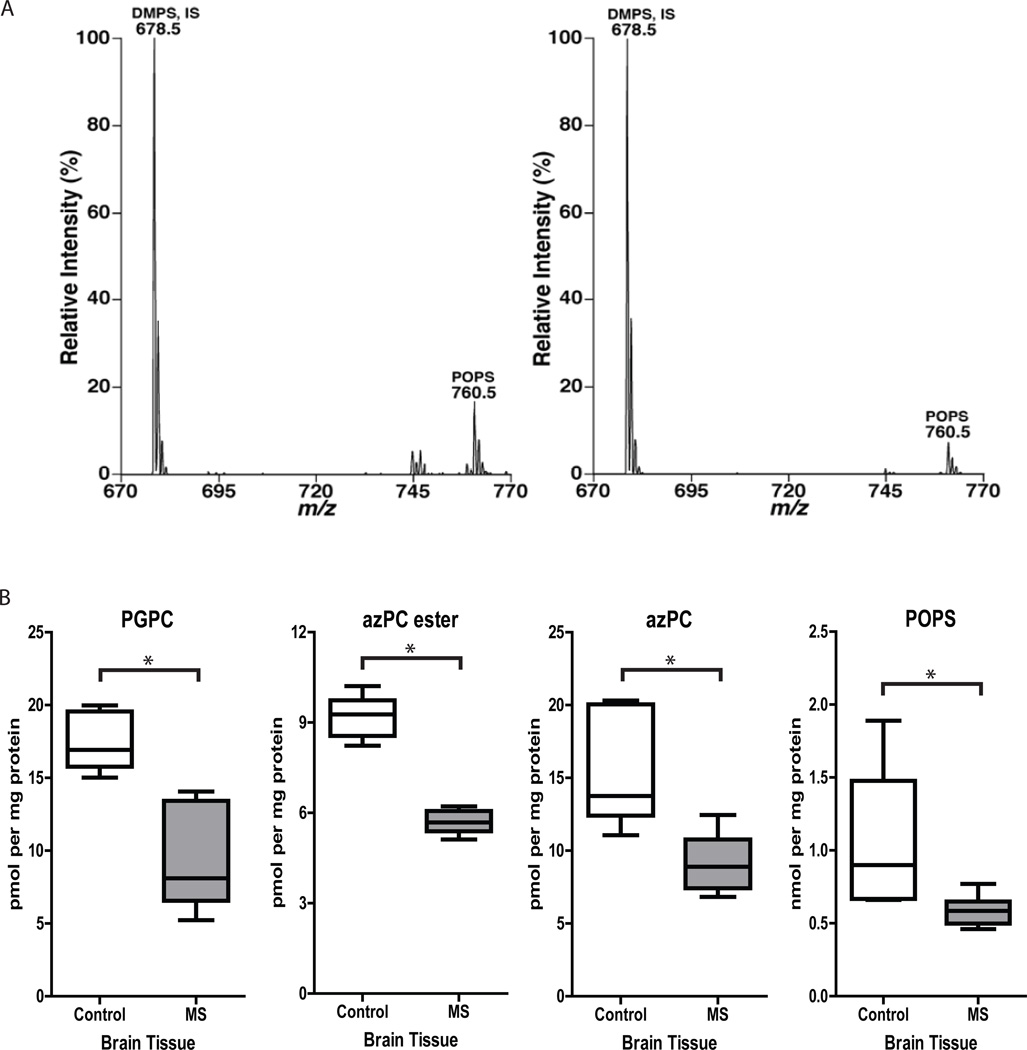
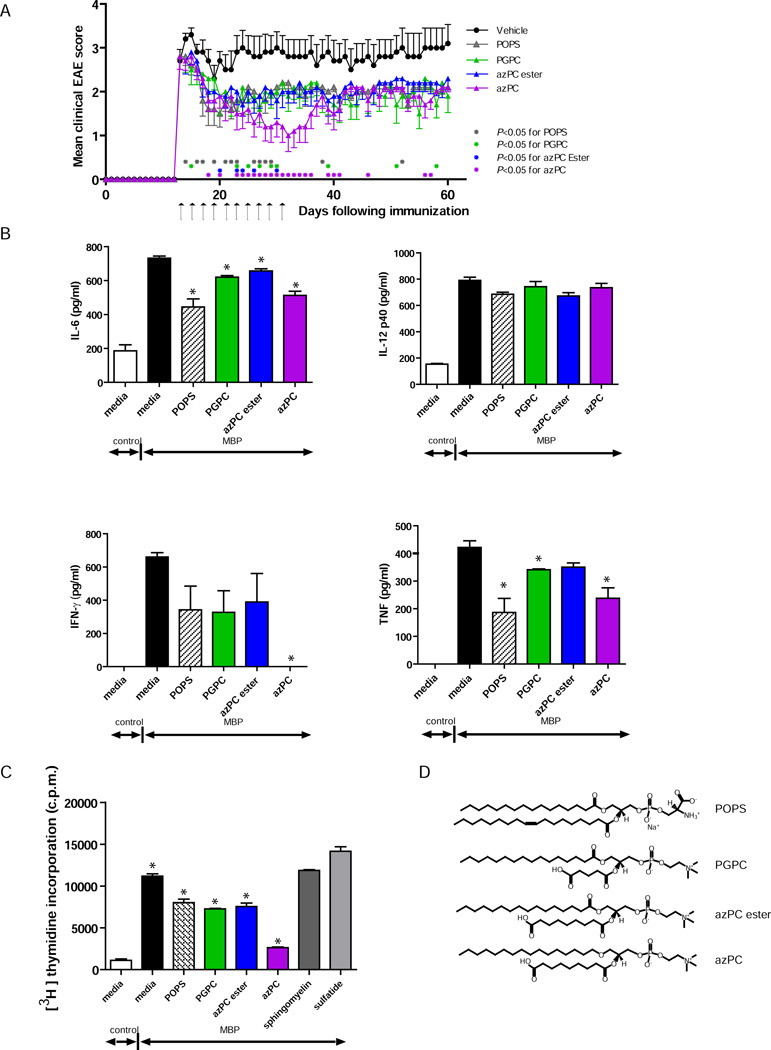
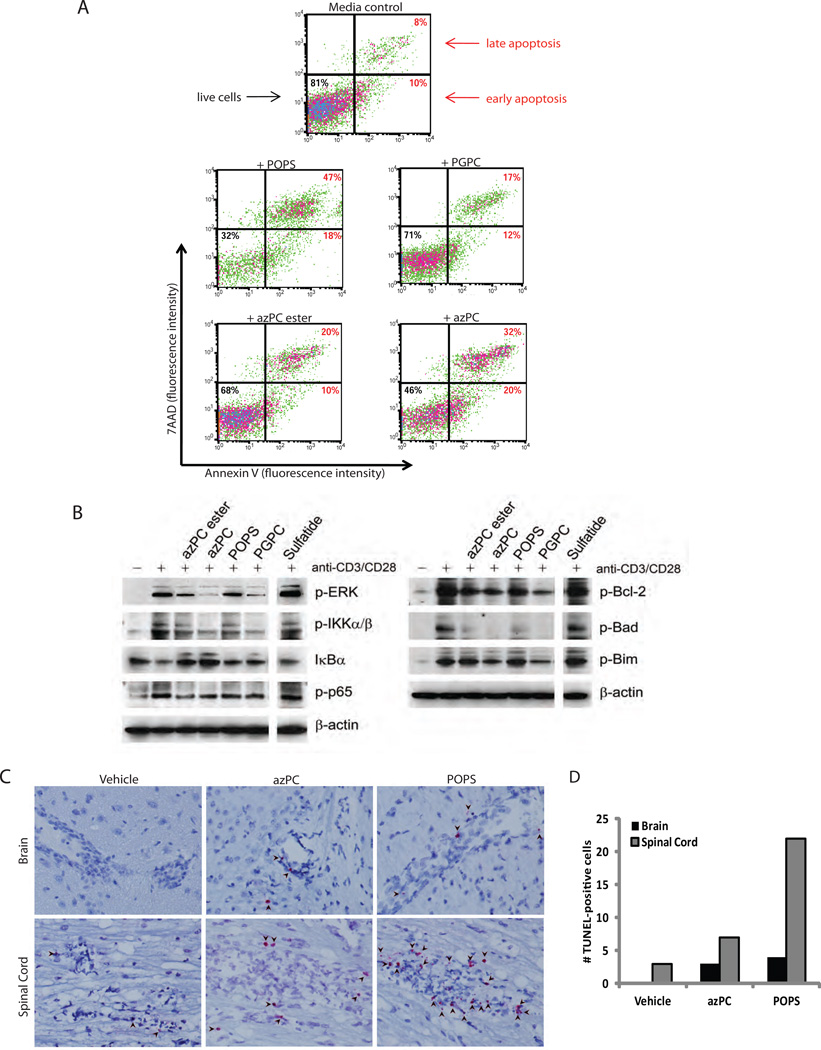
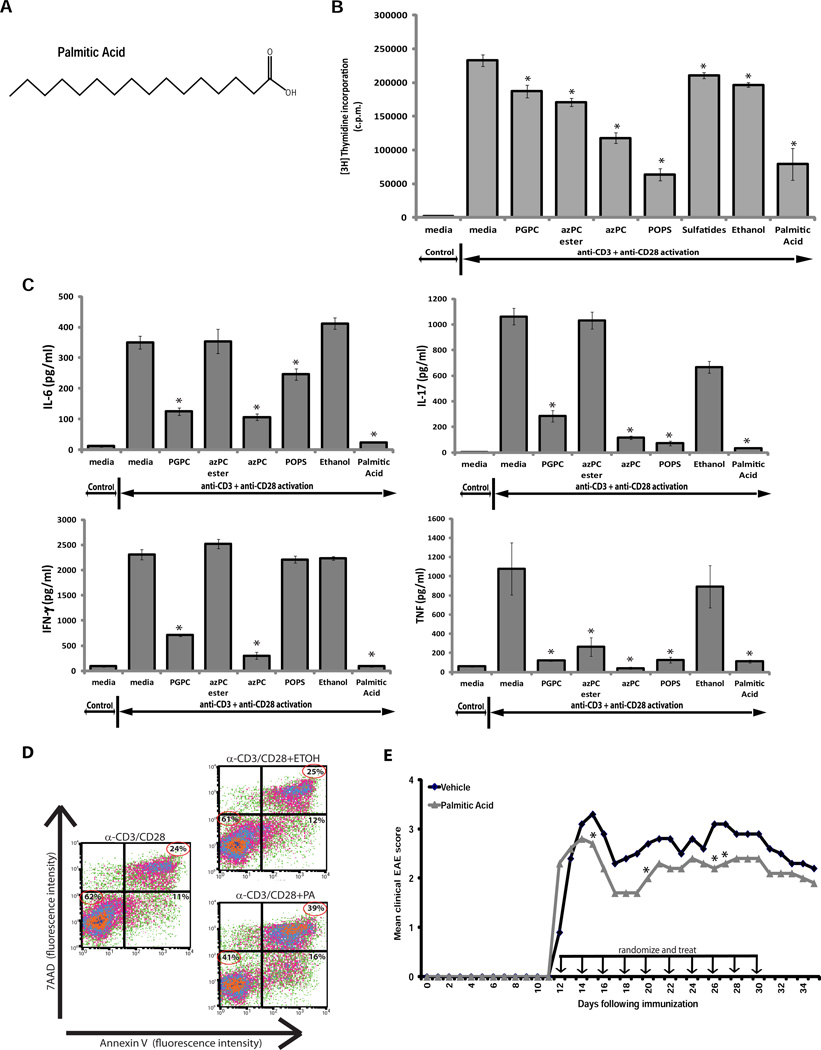
Lipids constitute 70% of the myelin sheath, and autoantibodies against lipids may contribute to the demyelination that characterizes multiple sclerosis (MS). We used lipid antigen microarrays and lipid mass spectrometry to identify bona fide lipid targets of the autoimmune response in MS brain, and an animal model of MS to explore the role of the identified lipids in autoimmune demyelination. We found that autoantibodies in MS target a phosphate group in phosphatidylserine and oxidized phosphatidylcholine derivatives. Administration of these lipids ameliorated experimental autoimmune encephalomyelitis by suppressing activation and inducing apoptosis of autoreactive T cells, effects mediated by the lipids' saturated fatty acid side chains. Thus, phospholipids represent a natural anti-inflammatory class of compounds that have potential as therapeutics for MS.
Figures
Similar articles
-
Identification of autoantibodies associated with myelin damage in multiple sclerosis.Nat Med. 1999 Feb;5(2):170-5. doi: 10.1038/5532. Nat Med. 1999. PMID: 9930864
-
Autoreactive T lymphocytes in multiple sclerosis: pathogenic role and therapeutic targeting.Acta Neurol Belg. 1999 Mar;99(1):65-9. Acta Neurol Belg. 1999. PMID: 10218096 Review.
-
Intrathecal administration of neutralizing antibody against Fas ligand suppresses the progression of experimental autoimmune encephalomyelitis.Biochem Biophys Res Commun. 2000 Aug 18;275(1):164-8. doi: 10.1006/bbrc.2000.3279. Biochem Biophys Res Commun. 2000. PMID: 10944459
-
The role of CD1-mediated presentation of myelin lipids in experimental autoimmune encephalomyelitis and multiple sclerosis pathologenesis.Drug News Perspect. 2003 Nov;16(9):574-84. doi: 10.1358/dnp.2003.16.9.829339. Drug News Perspect. 2003. PMID: 14702138 Review.
-
Increasing acetyl-CoA metabolism attenuates injury and alters spinal cord lipid content in mice subjected to experimental autoimmune encephalomyelitis.J Neurochem. 2017 Jun;141(5):721-737. doi: 10.1111/jnc.14032. Epub 2017 May 2. J Neurochem. 2017. PMID: 28369944
Cited by
-
Role of alarmins in poststroke inflammation and neuronal repair.Semin Immunopathol. 2023 May;45(3):427-435. doi: 10.1007/s00281-022-00961-5. Epub 2022 Sep 26. Semin Immunopathol. 2023. PMID: 36161515 Review.
-
Autoantibodies against central nervous system antigens in a subset of B cell-dominant multiple sclerosis patients.Proc Natl Acad Sci U S A. 2020 Sep 1;117(35):21512-21518. doi: 10.1073/pnas.2011249117. Epub 2020 Aug 18. Proc Natl Acad Sci U S A. 2020. PMID: 32817492 Free PMC article.
-
Mitochondrial and metabolic dysfunction of peripheral immune cells in multiple sclerosis.J Neuroinflammation. 2024 Jan 20;21(1):28. doi: 10.1186/s12974-024-03016-8. J Neuroinflammation. 2024. PMID: 38243312 Free PMC article. Review.
-
Distinct oligoclonal band antibodies in multiple sclerosis recognize ubiquitous self-proteins.Proc Natl Acad Sci U S A. 2016 Jul 12;113(28):7864-9. doi: 10.1073/pnas.1522730113. Epub 2016 Jun 20. Proc Natl Acad Sci U S A. 2016. PMID: 27325759 Free PMC article.
-
Myelin alters the inflammatory phenotype of macrophages by activating PPARs.Acta Neuropathol Commun. 2013 Aug 2;1:43. doi: 10.1186/2051-5960-1-43. Acta Neuropathol Commun. 2013. PMID: 24252308 Free PMC article.
References
-
- Genain CP, Cannella B, Hauser SL, Raine CS. Identification of autoantibodies associated with myelin damage in multiple sclerosis. Nat Med. 1999;5:170–175. - PubMed
-
- Kanter JL, Narayana S, Ho PP, Catz I, Warren KG, Sobel RA, Steinman L, Robinson WH. Lipid microarrays identify key mediators of autoimmune brain inflammation. Nat Med. 2006;12:138–143. - PubMed
-
- Pender MP, Csurhes PA, Wolfe NP, Hooper KD, Good MF, McCombe PA, Greer JM. Increased circulating T cell reactivity to GM3 and GQ1b gangliosides in primary progressive multiple sclerosis. J Clin Neurosci. 2003;10:63–66. - PubMed
-
- Quintana FJ, Farez MF, Viglietta V, Iglesias AH, Merbl Y, Izquierdo G, Lucas M, Basso AS, Khoury SJ, Lucchinetti CF, Cohen IR, Weiner HL. Antigen microarrays identify unique serum autoantibody signatures in clinical and pathologic subtypes of multiple sclerosis. Proc Natl Acad Sci U S A. 2008;105:18889–18894. - PMC - PubMed
Publication types
MeSH terms
Substances
Grants and funding
LinkOut - more resources
Full Text Sources
Other Literature Sources
Molecular Biology Databases
