

Improved prediction of Alzheimer's disease with longitudinal white matter/gray matter contrast changes
- PMID: 22674625
- PMCID: PMC6870108
- DOI: 10.1002/hbm.22103
Improved prediction of Alzheimer's disease with longitudinal white matter/gray matter contrast changes
Abstract
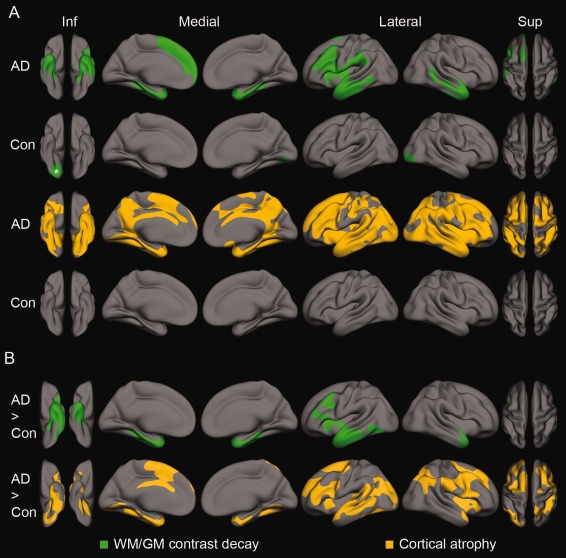
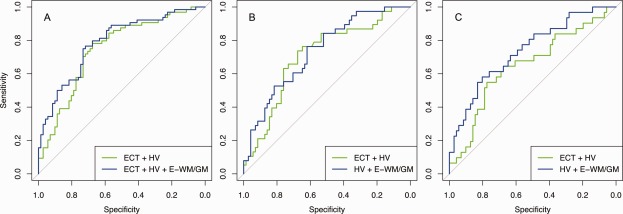
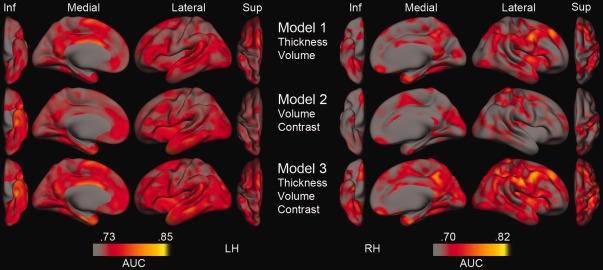
Brain morphometry measures derived from magnetic resonance imaging (MRI) are important biomarkers for Alzheimer's disease (AD). The objective of the present study was to test whether we could improve morphometry-based detection and prediction of disease state by use of white matter/gray matter (WM/GM) signal intensity contrast obtained from conventional MRI scans. We hypothesized that including WM/GM contrast change along with measures of atrophy in the entorhinal cortex and the hippocampi would yield better classification of AD patients, and more accurate prediction of early disease progression. T1 -weighted MRI scans from two sessions approximately 2 years apart from 78 participants with AD (Clinical Dementia Rating (CDR) = 0.5-2) and 71 age-matched controls were used to calculate annual change rates. Results showed that WM/GM contrast decay was larger in AD compared with controls in the medial temporal lobes. For the discrimination between AD and controls, entorhinal WM/GM contrast decay contributed significantly when included together with decrease in entorhinal cortical thickness and hippocampal volume, and increased the area under the curve to 0.79 compared with 0.75 when using the two morphometric variables only. Independent effects of WM/GM contrast decay and improved classification were also observed for the CDR-based subgroups, including participants converting from either a non-AD status to very mild AD, or from very mild to mild AD. Thus, WM/GM contrast decay increased diagnostic accuracy beyond what was obtained by well-validated morphometric measures alone. The findings suggest that signal intensity properties constitute a sensitive biomarker for cerebral degeneration in AD.
Keywords: MRI T1-weighted signal intensity; cerebral cortex; cortical thickness; disease prediction; entorhinal; hippocampus; tissue contrast.
Copyright © 2012 Wiley Periodicals, Inc.
Figures
Similar articles
-
Following the Spreading of Brain Structural Changes in Alzheimer's Disease: A Longitudinal, Multimodal MRI Study.J Alzheimers Dis. 2015;47(4):995-1007. doi: 10.3233/JAD-150196. J Alzheimers Dis. 2015. PMID: 26401778
-
Hippocampal degeneration is associated with temporal and limbic gray matter/white matter tissue contrast in Alzheimer's disease.Neuroimage. 2011 Feb 1;54(3):1795-802. doi: 10.1016/j.neuroimage.2010.10.034. Epub 2010 Oct 18. Neuroimage. 2011. PMID: 20965261 Free PMC article.
-
Episodic memory impairment in patients with Alzheimer's disease is correlated with entorhinal cortex atrophy. A voxel-based morphometry study.J Neurol. 2007 Jun;254(6):774-81. doi: 10.1007/s00415-006-0435-1. Epub 2007 Apr 3. J Neurol. 2007. PMID: 17404777
-
Relevance of magnetic resonance imaging for early detection and diagnosis of Alzheimer disease.Med Clin North Am. 2013 May;97(3):399-424. doi: 10.1016/j.mcna.2012.12.013. Epub 2013 Feb 1. Med Clin North Am. 2013. PMID: 23642578 Review.
-
Diffusion tensor imaging of white matter degeneration in Alzheimer's disease and mild cognitive impairment.Neuroscience. 2014 Sep 12;276:206-15. doi: 10.1016/j.neuroscience.2014.02.017. Epub 2014 Feb 27. Neuroscience. 2014. PMID: 24583036 Review.
Cited by
-
High spatial overlap but diverging age-related trajectories of cortical magnetic resonance imaging markers aiming to represent intracortical myelin and microstructure.Hum Brain Mapp. 2023 Jun 1;44(8):3023-3044. doi: 10.1002/hbm.26259. Epub 2023 Mar 10. Hum Brain Mapp. 2023. PMID: 36896711 Free PMC article.
-
The effect of age on vertex-based measures of the grey-white matter tissue contrast in autism spectrum disorder.Mol Autism. 2018 Oct 1;9:49. doi: 10.1186/s13229-018-0232-6. eCollection 2018. Mol Autism. 2018. PMID: 30302187 Free PMC article.
-
Cortical gray to white matter signal intensity ratio as a sign of neurodegeneration and cognition independent of β-amyloid in dementia.Hum Brain Mapp. 2024 Jan;45(1):e26532. doi: 10.1002/hbm.26532. Epub 2023 Nov 27. Hum Brain Mapp. 2024. PMID: 38013633 Free PMC article.
-
Altered gray-to-white matter tissue contrast in preterm-born adults.CNS Neurosci Ther. 2023 Nov;29(11):3199-3211. doi: 10.1111/cns.14320. Epub 2023 Jun 27. CNS Neurosci Ther. 2023. PMID: 37365964 Free PMC article.
-
Accelerated longitudinal gray/white matter contrast decline in aging in lightly myelinated cortical regions.Hum Brain Mapp. 2016 Oct;37(10):3669-84. doi: 10.1002/hbm.23267. Epub 2016 May 26. Hum Brain Mapp. 2016. PMID: 27228371 Free PMC article.
References
-
- Barbier EL, Marrett S, Danek A, Vortmeyer A, van Gelderen P, Duyn J, Bandettini P, Grafman J, Koretsky AP (2002): Imaging cortical anatomy by high‐resolution MR at 3.0T: Detection of the stripe of Gennari in visual area 17. Magn Reson Med 48:735–738. - PubMed
-
- Berg L (1988): Clinical dementia rating (CDR). Psychopharmacol Bull 24:637–639. - PubMed
-
- Braak H, Braak E (1991): Neuropathological stageing of Alzheimer‐related changes. Acta Neuropathol 82:239–259. - PubMed
Publication types
MeSH terms
LinkOut - more resources
Full Text Sources
Medical
