Reticular formation responses to magnetic brain stimulation of primary motor cortex
- PMID: 22674723
- PMCID: PMC3464356
- DOI: 10.1113/jphysiol.2011.226209
Reticular formation responses to magnetic brain stimulation of primary motor cortex
Abstract
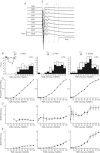
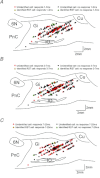
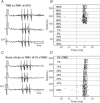
Transcranial magnetic stimulation (TMS) of cerebral cortex is a popular technique for the non-invasive investigation of motor function. TMS is often assumed to influence spinal circuits solely via the corticospinal tract. We were interested in possible trans-synaptic effects of cortical TMS on the ponto-medullary reticular formation in the brainstem, which is the source of the reticulospinal tract and could also generate spinal motor output. We recorded from 210 single units in the reticular formation of three anaesthetized macaque monkeys whilst TMS was performed over primary motor cortex. Short latency responses were observed consistent with activation of a cortico-reticular pathway. However, we also demonstrated surprisingly powerful responses at longer latency, which often appeared at lower threshold than the earlier effects. These late responses seemed to be generated partly as a consequence of the sound click made by coil discharge, and changed little with coil location. This novel finding has implications for the design of future studies using TMS, as well as suggesting a means of non-invasively probing an otherwise inaccessible important motor centre.
Figures


Similar articles
-
Corticobulbar projections from distinct motor cortical areas to the reticular formation in macaque monkeys.Eur J Neurosci. 2017 Jun;45(11):1379-1395. doi: 10.1111/ejn.13576. Epub 2017 May 2. Eur J Neurosci. 2017. PMID: 28394483
-
Effects of combined cortical and acoustic stimuli on muscle activity.Exp Brain Res. 2004 Jul;157(1):1-9. doi: 10.1007/s00221-003-1809-6. Epub 2004 Feb 17. Exp Brain Res. 2004. PMID: 14968278
-
Extensive Cortical Convergence to Primate Reticulospinal Pathways.J Neurosci. 2021 Feb 3;41(5):1005-1018. doi: 10.1523/JNEUROSCI.1379-20.2020. Epub 2020 Dec 2. J Neurosci. 2021. PMID: 33268548 Free PMC article.
-
The contribution of transcranial magnetic stimulation in the functional evaluation of microcircuits in human motor cortex.Front Neural Circuits. 2013 Feb 13;7:18. doi: 10.3389/fncir.2013.00018. eCollection 2013. Front Neural Circuits. 2013. PMID: 23407686 Free PMC article. Review.
-
Transcranial magnetic stimulation: a non-invasive window into the excitatory circuits involved in human motor behavior.Exp Brain Res. 2020 Aug;238(7-8):1637-1644. doi: 10.1007/s00221-020-05803-0. Epub 2020 Apr 18. Exp Brain Res. 2020. PMID: 32306064 Review.
Cited by
-
Mapping the corticoreticular pathway from cortex-wide anterograde axonal tracing in the mouse.J Neurosci Res. 2021 Dec;99(12):3392-3405. doi: 10.1002/jnr.24975. Epub 2021 Oct 22. J Neurosci Res. 2021. PMID: 34676909 Free PMC article.
-
The effects of music combined to paired associative stimulation on motor-evoked potentials and alertness in spinal cord injury patients and healthy subjects.Sci Rep. 2024 May 3;14(1):10194. doi: 10.1038/s41598-024-60984-w. Sci Rep. 2024. PMID: 38702398 Free PMC article.
-
Postural support requirements preferentially modulate late components of the gastrocnemius response to transcranial magnetic stimulation.Exp Brain Res. 2022 Oct;240(10):2647-2657. doi: 10.1007/s00221-022-06440-5. Epub 2022 Aug 25. Exp Brain Res. 2022. PMID: 36006434 Free PMC article.
-
Association between white matter integrity and lower limb motor impairment after stroke: A systematic review: White matter integrity and lower limb motor impairment after stroke.Braz J Phys Ther. 2025 Jan-Feb;29(1):101153. doi: 10.1016/j.bjpt.2024.101153. Epub 2024 Dec 3. Braz J Phys Ther. 2025. PMID: 39631242 Free PMC article.
-
Impact of Voluntary Muscle Activation on Stretch Reflex Excitability in Individuals With Hemiparetic Stroke.Front Neurol. 2022 Mar 8;13:764650. doi: 10.3389/fneur.2022.764650. eCollection 2022. Front Neurol. 2022. PMID: 35359658 Free PMC article.
References
-
- Aertsen AMHJ, Gerstein GL. Evaluation of neuronal connectivity: sensitivity of cross correlation. Brain Res. 1985;340:341–354. - PubMed
-
- Alagona G, Delvaux V, Gerard P, De Pasqua V, Pennisi G, Delwaide PJ, Nicoletti F, Maertens de Noordhout A. Ipsilateral motor responses to focal transcranial magnetic stimulation in healthy subjects and acute-stroke patients. Stroke. 2001;32:1304–1309. - PubMed
-
- Allen GI, Tsukahara N. Cerebrocerebellar communication systems. Physiol Rev. 1974;54:975. - PubMed
-
- Bantli H, Bloedel JR. Monosynaptic activation of a direct reticulo-spinal pathway by the dentate nucleus. Pflugers Arch. 1975;357:237–242. - PubMed
Publication types
MeSH terms
Grants and funding
LinkOut - more resources
Full Text Sources

