. 2012 Sep 13;120(11):2167-73.
doi: 10.1182/blood-2012-03-417824. Epub 2012 Jun 6.

Revealing the role of phospholipase Cβ3 in the regulation of VEGF-induced vascular permeability

Affiliations

Revealing the role of phospholipase Cβ3 in the regulation of VEGF-induced vascular permeability

Luke H Hoeppner et al. Blood. .

Abstract

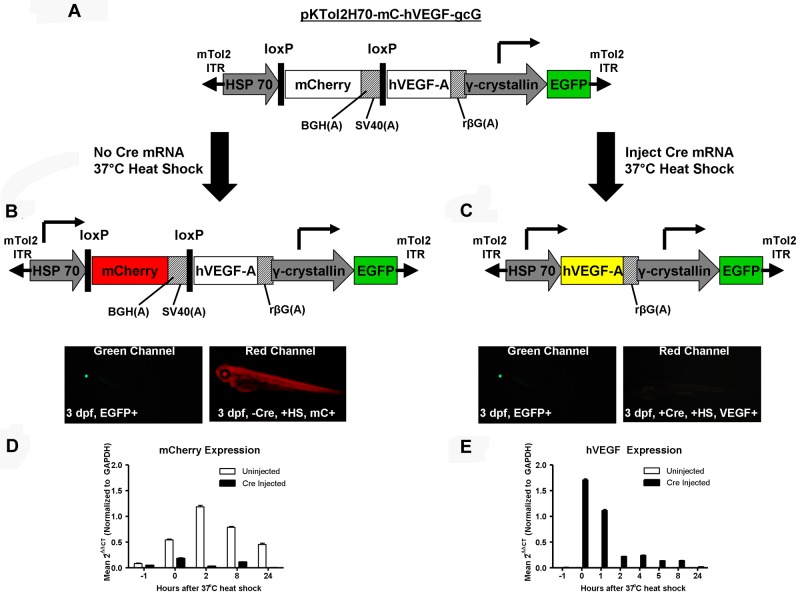
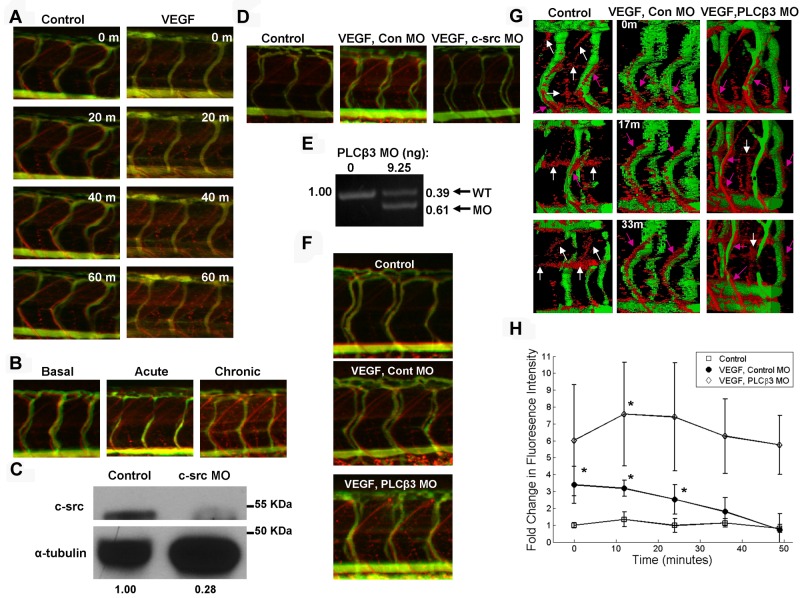
VEGF induces vascular permeability (VP) in ischemic diseases and cancer, leading to many pathophysiological consequences. The molecular mechanisms by which VEGF acts to induce hyperpermeability are poorly understood and in vivo models that easily facilitate real-time, genetic studies of VP do not exist. In the present study, we report a heat-inducible VEGF transgenic zebrafish (Danio rerio) model through which VP can be monitored in real time. Using this approach with morpholino-mediated gene knock-down and knockout mice, we describe a novel role of phospholipase Cβ3 as a negative regulator of VEGF-mediated VP by regulating intracellular Ca2+ release. Our results suggest an important effect of PLCβ3 on VP and provide a new model with which to identify genetic regulators of VP crucial to several disease processes.


Figures

Figure 1
Figure 1
Scheme of the transgenic heat-inducible VEGF zebrafish. (A) The pKTol2H70-mC-hVEGF-gcG transgene composed of a heat-inducible HSP70 promoter driving a floxed mCherry gene and hVEGF and a γ-crystallin promoter driving EGFP. mTol2 ITR indicates mini-Tol2 plasmid inverted terminal repeat; BGH(A), bovine growth hormone polyadenylation signal; SV40(A), simian virus 40 polyadenylation signal; rβG(A), rabbit β-globin polyadenylation signal. (B) The HSP70 promoter drives transcription of the mCherry gene, producing a red fluorescent protein in transgenic zebrafish. The lens-specific γ-crystallin promoter drives EGFP in the eyes. mC indicates mCherry; HS, heat shock. (C) Microinjection of cre recombinase mRNA into single-cell embryos results in the excision of the floxed mCherry gene, and subsequent heat-shock induction of the HSP70 promoter produces hVEGF. (D-E) Noninjected and cre recombinase–injected transgenic zebrafish were heat shocked at 37°C at 3 dpf to monitor the temporal expression of mCherry (D) and hVEGF (E) transcripts after induction of HSP70.
Figure 2
Figure 2
VEGF induction promotes VP, which is increased by PLCβ3 knockdown. Microangiography was performed on 3-dpf zebrafish with red-permeabilizing tracer and green ISV marker (A,B,D,F-G). (A) Control and VEGF-induced zebrafish were imaged in real time at the indicated time points. Three-dimensional rotating images are shown in supplemental Videos 1 and 2. (B) Basal, acute, and chronic (0, 1, and 3 VEGF inductions, respectively) VP was assessed at 3 dpf and representative images are shown. (C) MO-mediated knockdown of c-src was confirmed by immunoblotting in 3-dpf zebrafish with α-tubulin as a loading control. Densitometric analysis revealed 72% knockdown of c-src. (D) Representative images of extravasated Texas Red-dextran are shown in control; VEGF-induced, control MO-injected; and VEGF-induced, c-src MO–injected 3-dpf zebrafish. (E) Control MO- and PLCβ3 MO–injected 3-dpf zebrafish cDNA was used for PCR to demonstrate a molar ratio of 39% wild-type (WT) to 61% PLCβ3 MO PCR product. (F) Control; VEGF-induced, control MO–injected; and VEGF-induced, PLCβ3 MO–injected zebrafish were imaged in real time and representative images are shown. (G) Surface projection representation of confocal live imaging performed at the indicated times on a set of similarly treated zebrafish. Pink arrows indicate tracer extravasated directly from ISVs; white arrows, tracer within diagonal and horizontal lymphatic vessels. See supplemental Videos 3 through 5 for live fluorescence microscopy and supplemental Videos 6 through 8 for real-time surface projection confocal imaging. (H) Quantitation of confocal time-lapse imaging. Open squares indicate controls (n = 4); closed circles, VEGF-induced, control MO (n = 4); and open diamonds, VEGF-induced, PLCβ3 MO (n = 5). *P < .05 for control versus VEGF-induced, control MO or VEGF-induced, control MO versus VEGF-induced, PLCβ3 MO. Error bars represent SD. Images depicted in panels A, B, D, and F were obtained using a Zeiss Apitome microscope equipped with a Fluar 5×, 0.25 numerical aperture lens at room temperature. Images shown in panel G were acquired using a Zeiss LSM 780 confocal microscope equipped with an LD Plan Neofluar 40×, 0.6 numerical aperture lens at room temperature.
Figure 3
Figure 3
PLCβ3 null mice exhibit greater VEGF-induced VP than wild-type mice. (A-B) VEGF-induced VP was evaluated in wild-type and PLCβ3–null mice (n = 5/group). FITC signal, normalized to t0, is shown for subdermal PBS control and VEGF injections. The average fold change in signal after injection for wild-type (A) and PLCβ3 (B) mice. Representative ear images from 10 and 30 minutes after injection are shown in the panels on the right. Maximum induction mean for PLCβ3 was 3.319 ± 0.7385 versus wild-type, 1.518 ± 0.1187 (P = .0468). Error bars represent SD.
Figure 4
Figure 4
PLCβ3 regulates intracellular Ca2+ entry into the cell. (A-C) Human umbilical vein endothelial cells transfected with PLCβ3 (A,C), PLCγ (B), or control shRNA (A-C) were serum starved overnight, loaded with Fura-2 AM, and then stimulated with VEGF (10 ng/mL) at 100 seconds. (C) To distinguish intracellular Ca2+ release from the ER from Ca2+ entry into the cell, EGTA was added before VEGF stimulation at 50 seconds to measure ER release and CaCl2 was added at 750 seconds to assess cellular entry. (D) Microangiography using red-permeabilizing tracer and green ISV marker was performed on 3-dpf control (top panel); VEGF-induced, PLCβ3 MO–treated (middle panel); and VEGF-induced, PLCβ3 MO–treated zebrafish with 100μM BAPTA-AM added to the water 24 hours before VEGF induction (bottom panel). Representative images shown were obtained using a Zeiss Apitome microscope equipped with a Fluar 5×, 0.25 numerical aperture lens at room temperature. (E) Schematic of proposed model. VEGF binding to VEGF receptors causes increased intracellular Ca2+ (through Ca2+ entry into the cell and Ca2+ release from the endoplasmic reticulum). Elevated intracellular Ca2+ levels promote increased vascular permeability. Activated PLCβ3 inhibits Ca2+ entry into the cell, leading to a decrease in VEGF-induced vascular permeability.

Comment in

Similar articles

Cited by

References

    1. Senger DR, Galli SJ, Dvorak AM, Perruzzi CA, Harvey VS, Dvorak HF. Tumor cells secrete a vascular permeability factor that promotes accumulation of ascites fluid. Science. 1983;219(4587):983–985. - PubMed
    1. Leung DW, Cachianes G, Kuang WJ, Goeddel DV, Ferrara N. Vascular endothelial growth factor is a secreted angiogenic mitogen. Science. 1989;246(4935):1306–1309. - PubMed
    1. Carmeliet P, Ferreira V, Breier G, et al. Abnormal blood vessel development and lethality in embryos lacking a single VEGF allele. Nature. 1996;380(6573):435–439. - PubMed
    1. Ferrara N, Carver-Moore K, Chen H, et al. Heterozygous embryonic lethality induced by targeted inactivation of the VEGF gene. Nature. 1996;380(6573):439–442. - PubMed
    1. Nasevicius A, Larson J, Ekker SC. Distinct requirements for zebrafish angiogenesis revealed by a VEGF-A morphant. Yeast. 2000;17(4):294–301. - PMC - PubMed

Publication types

MeSH terms