. 2012 Aug;86(16):8581-91.
doi: 10.1128/JVI.00533-12. Epub 2012 Jun 6.

Hepatitis C virus NS5A disrupts STAT1 phosphorylation and suppresses type I interferon signaling

Affiliations

Hepatitis C virus NS5A disrupts STAT1 phosphorylation and suppresses type I interferon signaling

Kattareeya Kumthip et al. J Virol. 2012 Aug.

Abstract

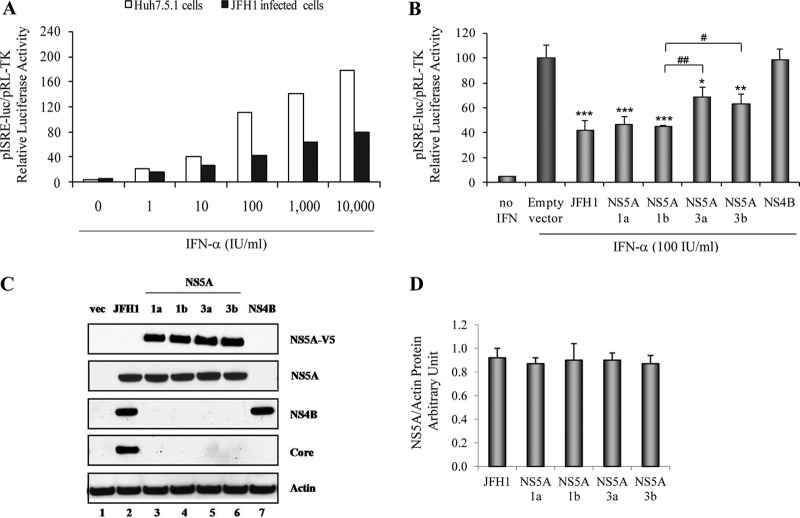
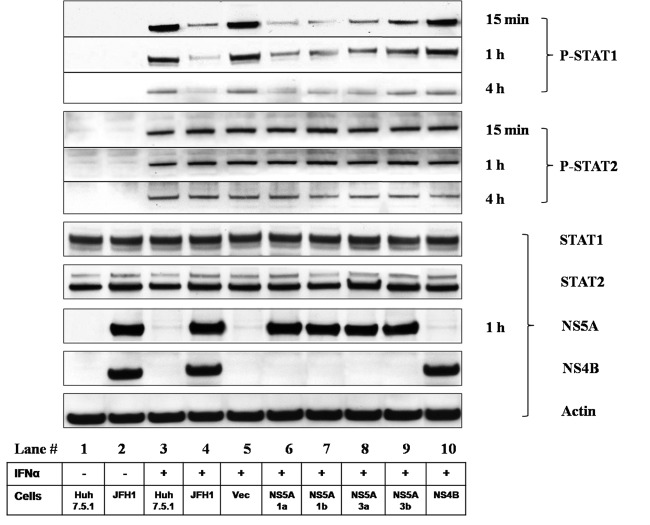
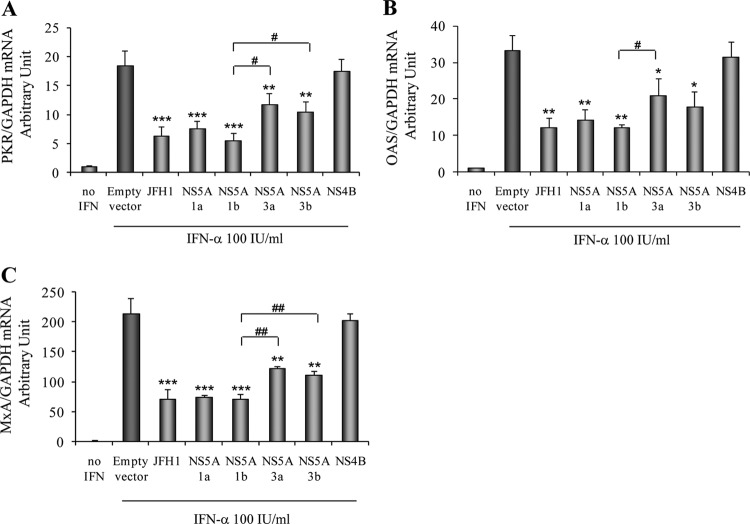
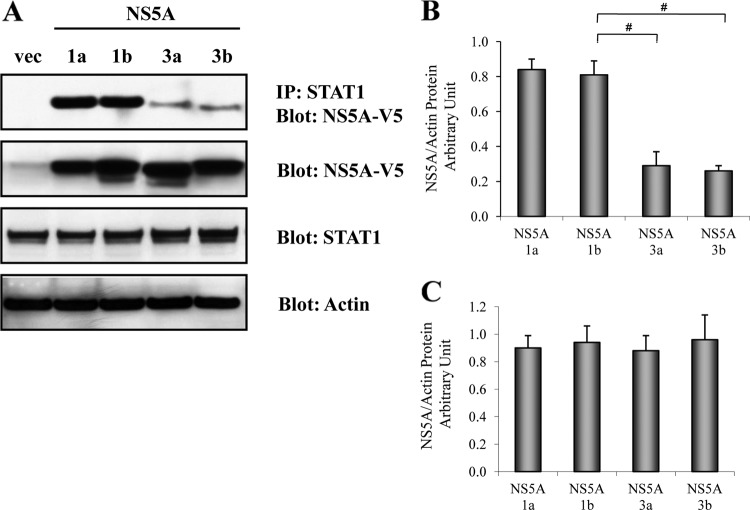
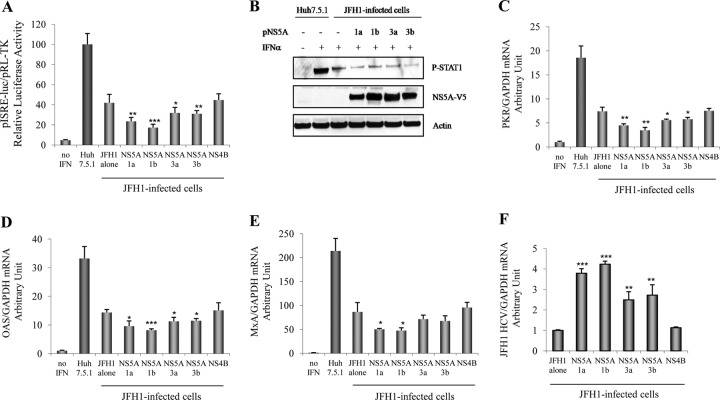
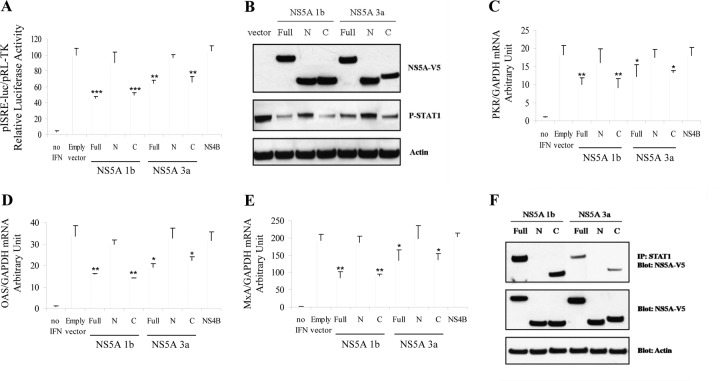
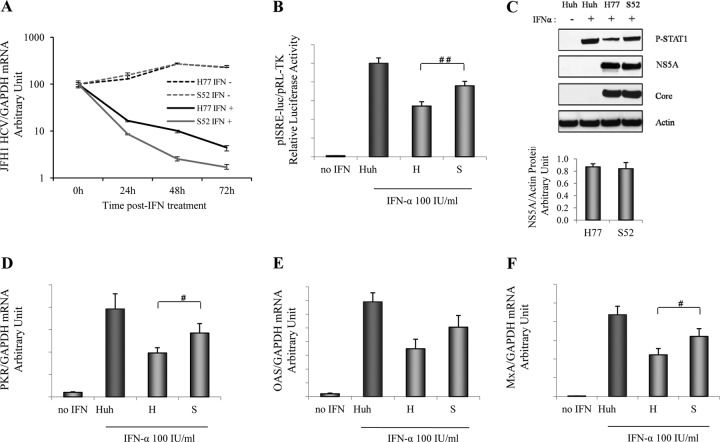
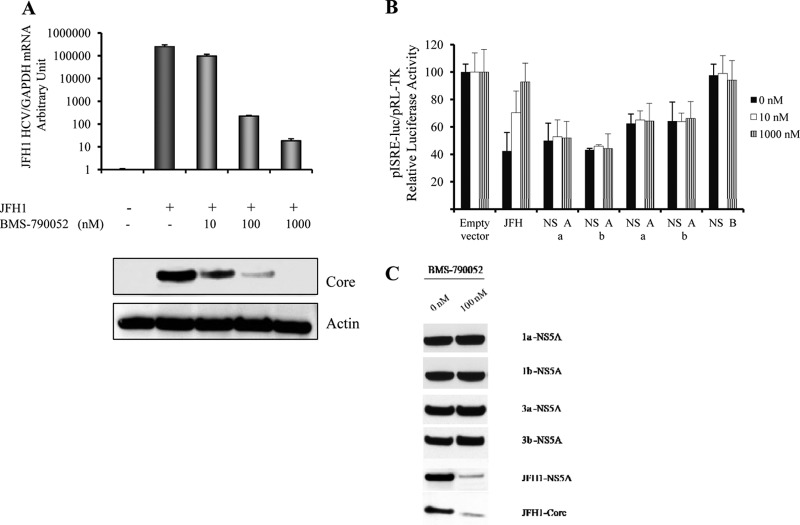
Responses to alpha interferon (IFN-α)-based treatment are dependent on both host and viral factors and vary markedly among patients infected with different hepatitis C virus (HCV) genotypes (GTs). Patients infected with GT3 viruses consistently respond better to IFN treatment than do patients infected with GT1 viruses. The mechanisms underlying this difference are not well understood. In this study, we sought to determine the effects of HCV NS5A proteins from different genotypes on IFN signaling. We found that the overexpression of either GT1 or GT3 NS5A proteins significantly inhibited IFN-induced IFN-stimulated response element (ISRE) signaling, phosphorylated STAT1 (P-STAT1) levels, and IFN-stimulated gene (ISG) expression compared to controls. GT1 NS5A protein expression exhibited stronger inhibitory effects on IFN signaling than did GT3 NS5A protein expression. Furthermore, GT1 NS5A bound to STAT1 with a higher affinity than did GT3 NS5A. Domain mapping revealed that the C-terminal region of NS5A conferred these inhibitory effects on IFN signaling. The overexpression of HCV NS5A increased HCV replication levels in JFH1-infected cells through the further reduction of levels of P-STAT1, ISRE signaling, and downstream ISG responses. We demonstrated that the overexpression of GT1 NS5A proteins resulted in less IFN responsiveness than did the expression of GT3 NS5A proteins through stronger binding to STAT1. We confirmed that GT1 NS5A proteins exerted stronger IFN signaling inhibition than did GT3 NS5A proteins in an infectious recombinant JFH1 virus. The potent antiviral NS5A inhibitor BMS-790052 did not block NS5A-mediated IFN signaling suppression in an overexpression model, suggesting that NS5A's contributions to replication are independent of its subversive action on IFN. We propose a model in which the binding of the C-terminal region of NS5A to STAT1 leads to decreased levels of P-STAT1, ISRE signaling, and ISG transcription and, ultimately, to preferential GT1 resistance to IFN treatment.


Figures

Fig 1
Fig 1
JFH1 replication and overexpression of GT1a, GT1b, GT3a, and GT3b NS5A proteins inhibit IFN-α-induced ISRE promoter activity. (A) Huh7.5.1 cells and JFH1-infected Huh7.5.1 cells were cotransfected with plasmid pISRE-luc (expressing firefly luciferase) and pRL-TK (expressing Renilla luciferase). After 24 h, cells were treated with different doses of IFN-α: 1, 10, 100, 1,000, and 10,000 IU/ml. ISRE-mediated IFN signaling was monitored by a dual-luciferase reporter assay system at 24 h after IFN treatment. The multiplicity of infection of JFH1 in our experiments was 0.2. We found that JFH1-infected Huh7.5.1 cells were about 50% infected at 48 h and at least 95% infected at day 6 by HCV core immunofluorescence staining both in this study and in our previous report (30). (B) Full-length GT1a, GT1b, GT3a, or GT3b NS5A; NS4B constructs; or the empty vector control, pCAGGS-V5/His, was cotransfected with pISRE-luc and pRL-TK into Huh7.5.1 cells. The transfected cells were treated with 100 IU/ml of IFN-α for 24 h. Empty-vector-transfected cells were used as a negative control, and JFH1-infected Huh7.5.1 cells were used as a positive replication control. *, P < 0.05; **, P < 0.01; ***, P < 0.001 (compared with the empty vector control cells). #, P < 0.05; ##, P < 0.01 (compared between GT1 and GT3 NS5A proteins). (C) Western blot analysis of viral protein expression. Lane 1, pCAGGS-V5/His; lane 2, JFH1; lane 3, GT1a NS5A; lane 4, GT1b NS5A; lane 5, GT3a NS5A; lane 6, GT3b NS5A; lane 7, NS4B. (D) NS5A/actin protein arbitrary units (NAPAU) for JFH1, GT1a, GT1b, GT3a, and GT3b from the corresponding densitometry. The NAPAU (from three independent WB images) were 0.92 ± 0.08 (JFH1), 0.87 ± 0.05 (GT1a), 0.90 ± 0.14 (GT1b), 0.90 ± 0.06 (GT3a), and 0.87 ± 0.07 (GT3b), respectively. These data indicated relative equivalent NS5A protein expression levels for HCV JFH1, GT1a, GT1b, GT3a, and GT3b.
Fig 2
Fig 2
HCV NS5A reduces STAT1 phosphorylation. The inhibitory effect of NS5A on IFN-α-induced STAT1 phosphorylation was assessed in cells expressing the NS5A protein. Huh7.5.1 cells were transfected with NS5A constructs for 48 h. Huh7.5.1, JFH1-infected Huh7.5.1, or construct-transfected Huh7.5.1 cells were incubated with IFN-α (100 IU/ml) for 15 min, 1 h, or 4 h. Whole-cell lysates were analyzed by Western blot analysis for P-STAT1, P-STAT2, STAT1, STAT2, NS5A, NS4B, and actin protein levels. IFN-α activated P-STAT1 and P-STAT2 levels in Huh7.5.1 cells (lane 3). JFH1-HCV replication (lane 4) as well as the overexpression of the GT1a, GT1b, GT3a, and GT3b NS5A proteins (lanes 6, 7, 8, and 9, respectively) strongly decreased P-STAT1 levels. The empty vector and NS4B overexpression had no effect on P-STAT1 levels (lanes 5 and 10, respectively). JFH1 infection or NS5A overexpression had no effect on P-STAT2 levels. GT1a and GT1b NS5A (lanes 6 and 7, respectively) expression exhibited a stronger suppression of P-STAT1 levels than did GT3a and GT3b NS5A (lanes 8 and 9, respectively) expression. Lanes: 1 and 3, Huh7.5.1 cells; 2 and 4, JFH1-infected Huh7.5.1 cells; 5, pCAGGS-V5/His; 6, GT1a NS5A; 7, GT1b NS5A; 8, GT3a NS5A; 9, GT3b NS5A; 10, NS4B. IFN-α treatment is shown in lanes 3 to 10.
Fig 3
Fig 3
Overexpression of NS5A reduces ISG mRNA levels. Huh7.5.1 cells were infected with HCV JFH1 or transfected with GT1a, GT1b, GT3a, or GT3b NS5A or NS4B constructs. Twenty-four hours after transfection, cells were treated with 100 IU/ml of IFN-α for another 24 h. Total RNA was harvested and reverse transcribed. The levels of ISGs mRNA were determined by quantitative real-time PCR. Each ISG mRNA level was normalized to the GAPDH level to obtain arbitrary units. (A) Overexpression of NS5A reduced PKR mRNA levels. (B) Overexpression of NS5A inhibited OAS mRNA expression levels. (C) Overexpression of NS5A reduced MxA mRNA levels. *, P < 0.05; **, P < 0.01; ***, P < 0.001 (for comparisons between NS5A overexpressions and the empty vector). #, P < 0.05; ##, P < 0.01 (for comparisons between GT1 and GT3 NS5A proteins).
Fig 4
Fig 4
GT1 NS5A has stronger binding to STAT1 than GT3 NS5A. The plasmid DNA constructs encoding HCV NS5A of GT1a, GT1b, GT3a, or GT3b were transfected into Huh7.5.1 cells. Cell lysates were harvested at 48 h after transfection. STAT1 immunoprecipitation was performed by using the Roche immunoprecipitation (IP) kit. IP cell lysates were separated by SDS-PAGE and transferred onto nitrocellulose membranes, followed by anti-V5 immunoblotting to determine interactions between NS5A and STAT1. (A) GT1a and GT1b NS5A proteins have stronger binding affinity for STAT1 than GT3a and GT3b NS5A proteins (top). Total cell lysates were used for Western blotting to monitor the expressions of the NS5A (anti-V5), STAT1, and actin proteins. (B) NAPAU for STAT1-IP lysates of GT1a, GT1b, GT3a, and GT3b from the corresponding densitometry. The NAPAU (from three independent WB images) were 0.84 ± 0.06 (GT1a), 0.81 ± 0.08 (GT1b), 0.29 ± 0.08 (GT3a), and 0.26 ± 0.23 (GT3b). These densitometry data confirmed that the GT1 (GT1a and GT1b) NS5A proteins had stronger binding to STAT1 than did the GT3 (GT3a and GT3b) NS5A proteins. (C) NAPAU for whole-cell lysates of GT1a, GT1b, GT3a, and GT3b from the corresponding densitometry. The NAPAU (from three independent WB images) were 0.90 ± 0.09 (GT1a), 0.94 ± 0.12 (GT1b), 0.88 ± 0.11 (GT3a), and 0.96 ± 0.18 (GT3b). These densitometry data verified the relative equal NS5A protein expression levels between GT1 (GT1a and GT1b) and GT3 (GT3a and GT3b).
Fig 5
Fig 5
Overexpression of NS5A further increases HCV replication in JFH1-infected Huh7.5.1 cells through stronger suppression of IFN signaling. GT1a, GT1b, GT3a, and GT3b NS5A and NS4B plasmids were cotransfected with pISRE-luc and pRL-TK into Huh7.5.1 cells for 18 h, followed by JFH1 infection for 6 h, and cells were then treated with IFN-α (100 IU/ml) for 24 h. Samples were harvested to measure the relative luciferase activity, protein for Western blot analysis, or mRNA for qPCR. (A) Cell lysates were harvested to measure the relative luciferase activity. The GT1a, GT1b, GT3a, and GT3b NS5A proteins exhibited stronger reductions of ISRE signaling than did JFH1 infection alone. NS4B overexpression showed no further decrease in signaling. The GT1a and GT1b NS5A proteins exhibited stronger reductions of ISRE signaling than did the GT3a and GT3b NS5A proteins. (B) Protein lysates were harvested for Western blotting to measure P-STAT1, NS5A-V5, and actin protein levels. The overexpression of NS5A in JFH1-infected Huh7.5.1 cells further reduced P-STAT1 levels compared to levels in cells infected with JFH1 alone. (C to E) Lysates were harvested to monitor PKR (C), OAS (D), and MxA (E) mRNA levels. The overexpression of NS5A further reduced PKR, OAS, and MxA mRNA levels in JFH1-infected Huh7.5.1 cells compared to levels in cells infected with JFH1 alone. The GT1a and GT1b NS5A proteins caused a stronger inhibition of the ISG mRNA levels than did the GT3a and GT3b NS5A proteins. In contrast, the overexpression of NS4B led to no further reduction in the expression levels of ISGs. (F) NS5A overexpression in JFH1-infected Huh7.5.1 cells further increased HCV replication levels compared to those in cells infected with JFH1 alone, whereas NS4B had no positive effect on HCV replication. The GT1a and GT1b NS5A proteins showed higher increases in HCV replication levels than did the GT3a and GT3b NS5A proteins. *, P < 0.05; **, P < 0.01; ***, P < 0.001 (for comparisons between the overexpression of GT1a, GT1b, GT3a, or GT3b NS5A and JFH1 infection alone).
Fig 6
Fig 6
C-terminal NS5A displays inhibitory effects on IFN signaling through binding to STAT1. Full-length HCV NS5A (aa 1 to 447) was also classified into domain I (aa 1 to 213), domain II (aa 250 to 342), and domain III (aa 356 to 447) in a previous report (42). To identify the NS5A domain responsible for the disruption of IFN signaling and the reduction of P-STAT1 levels, we constructed and transfected full-length NS5A (amino acids 1 to 447), N-terminal NS5A (aa 1 to 236) (domain I), and C-terminal NS5A (aa 237 to 447) (domains II and III) plasmids into Huh7.5.1 cells. Samples were harvested to measure the relative luciferase activity, protein for Western blotting, or mRNA for qPCR. (A) Full-length, N-terminal, or C-terminal NS5A plasmids or NS4B plasmids were cotransfected with pISRE-luc and pRL-TK into Huh7.5.1 cells for 24 h, and cells were then treated with IFN-α (100 IU/ml) for 24 h. Cell lysates were harvested to measure the dual-luciferase activity. The full-length and C-terminal NS5A proteins produced comparable degrees of ISRE signaling inhibition in both the GT1 and GT3 NS5A proteins. However, N-terminal NS5A or NS4B did not reduce ISRE signaling. (B) Full-length, N-terminal, or C-terminal NS5A plasmids were transfected into Huh7.5.1 cells for 48 h. Cells were then treated with IFN-α (100 IU/ml) for 1 h. Cell lysates were collected for a protein assay. Western blot analysis for NS5A-V5 confirmed the expression of full-length, C-terminal, or N-terminal NS5A (top). C-terminal and full-length NS5A overexpression (for both GT1b and GT3a) reduced P-STAT1 protein levels. In contrast, N-terminal NS5A had no effect on the P-STAT1 level (middle). Actin protein levels are shown in the bottom panel. (C to E) The empty vector or full-length NS5A, N-terminal or C-terminal NS5A, or NS4B plasmids were transfected into Huh7.5.1 cells. Cells were then treated with IFN-α (100 IU/ml) for 24 h. Cell lysates were harvested to measure mRNA levels. Full-length or C-terminal NS5A produced comparable levels of reduction of PKR (C), OAS (D), and MxA (E) mRNA levels compared to the empty vector for both GT1b and GT3a. N-terminal NS5A or NS4B overexpression did not reduce PKR, OAS, and MxA mRNA expression levels. *, P < 0.05; **, P < 0.01; ***, P < 0.001 (for comparisons between NS5A expressions and the vector control). (F) Full-length, N-terminal, or C-terminal NS5A constructs were transfected into Huh7.5.1 cells. Protein lysates were collected for STAT1 immunoprecipitation by using the Roche IP kit. Protein levels in the IP lysate (top) or whole-cell lysate (middle) were assessed by anti-V5 Western blotting. Full-length NS5A or the C terminus of NS5A (both GT1b and GT3a) bound to STAT1. In contrast, N-terminal NS5A did not bind to STAT1.
Fig 7
Fig 7
GT1 NS5A proteins exhibit higher levels of resistance to IFN than GT3 NS5A proteins in NS5A/JFH1 recombinant virus. To determine GT1 and 3 NS5A resistances to IFN in the replication model, we used the H77 (GT1a NS5A)/JFH1 (H77) and S52 (GT3a NS5A)/JFH1 (S52) recombinant viruses. Full-length NS5A in J6/JFH1 was replaced with GT1a or GT3a NS5A to generate the infectious recombinant virus H77 or S52, as previously reported (39). Huh7.5.1 cells were infected with the H77 or S52 recombinant virus. (A) HCV H77 and S52 respond to IFN treatment in a time-dependent manner. Twenty-four hours after infection, cells were treated with IFN-α (100 IU/ml) or without IFN for another 24, 48, and 72 h. We confirmed the relative equal HCV RNA levels between the H77 and S52 viruses without IFN treatment. We found that IFN treatments reduced HCV RNA levels in a time-dependent manner. S52 (GT3 NS5A) was more sensitive to IFN treatment than H77 (GT1 NS5A). (B) HCV H77 exhibited a stronger inhibition of ISRE signaling than HCV S52. Plasmids pISRE-luc and pRL-TK were cotransfected into H77- or S52-infected Huh7.5.1 cells for 24 h. Cells were treated with IFN-α (100 IU/ml) for another 24 h. The relative luciferase activity was finally assessed. We found that the H77 (GT1 NS5A) recombinant virus exhibited a greater reduction of IFN-induced ISRE signaling did HCV S52 (GT3 NS5A). ##, P < 0.01 (for comparisons between H77 and S52). (C) HCV H77 exhibited a greater reduction of the P-STAT1 level. Huh7.5.1 cell were infected with HCV H77 or S52 for 48 h. The cells were treated with IFN-α (100 IU/ml) for 1 h. IFN-α induced P-STAT1 accumulation in Huh7.5.1 cells. HCV H77 reduced the P-STAT1 protein level more than did HCV S52. The NAPAU for H77 and S52 were 0.87 ± 0.05 and 0.84 ± 0.10, respectively. HCV core and NS5A Western blotting confirmed the relative equal HCV replication levels between H77 and S52. (D to F) HCV H77 inhibited ISG expression more than HCV S52. Huh7.5.1 cells were infected with HCV H77 or S52 for 24 h. The cells were treated with IFN-α (100 IU/ml) for 24 h. Cell lysates were harvested to measure mRNA levels. H77 showed a stronger suppression of ISG expression levels, including PKR (D), OAS (E), and MxA (F) mRNA levels, than S52. #, P < 0.05 (for comparisons between H77 and S52).
Fig 8
Fig 8
BMS-790052 inhibits JFH1-HCV replication but has no effect on the overexpression of the NS5A protein. (A) BMS-790052 reduced HCV JFH1 RNA levels in a dose-dependent manner. JFH1-infected Huh7.5.1 cells were treated with the NS5A inhibitor BMS-790052 at 0, 10, 100, or 1,000 nM for an additional 24 h. HCV RNA and core protein levels were monitored to determine HCV replication levels. (Top) BMS-790052 reduced HCV RNA levels in JFH1-infected cells. (Bottom) HCV core Western blotting confirmed the reduction of HCV replication levels. (B) BMS-790052 had no effect on NS5A overexpression-mediated inhibition of ISRE signaling. Plasmids pISRE-luc and pRL-TK were cotransfected into JFH1-infected Huh7.5.1 cells or cotransfected with the empty vector; the GT1a, GT1b, GT3a, or GT3b NS5A plasmid; or the NS4B plasmid into Huh7.5.1 cells for 12 h. Cells were incubated with BMS-790052 at 0, 10, or 1,000 nM for an additional 12 h. Cells were then treated IFN-α (100 IU/ml) for 24 h. We found that HCV JFH1 replication or NS5A overexpression inhibited IFN-induced ISRE signaling. BMS-790052 rescued the HCV-mediated inhibition of ISRE signaling in the JFH1 replication model in a dose-dependent manner. However, BMS-790052 had no effect on the NS5A overexpression-mediated inhibition of ISRE signaling. (C) BMS-790052 had no effect on overexpressed NS5A proteins. JFH1-infected Huh7.5.1 cells or Huh7.5.1 cells transfected with the GT1a, GT1b, GT3a, or GT3b NS5A construct were treated with BMS-790052 at 0 nM or 100 nM for 24 h. Protein lysates were harvested for anti-NS5A-V5, NS5A, or HCV core Western blot analysis. BMS-790052 reduced HCV NS5A and core levels in JFH1-infected Huh7.5.1 cells. However, BMS-790052 did not affect NS5A overexpression protein levels.

Similar articles

Cited by

References

    1. Barth H, Liang TJ, Baumert TF. 2006. Hepatitis C virus entry: molecular biology and clinical implications. Hepatology 44:527–535 - PubMed
    1. Cai Z, et al. 2005. Robust production of infectious hepatitis C virus (HCV) from stably HCV cDNA-transfected human hepatoma cells. J. Virol. 79:13963–13973 - PMC - PubMed
    1. Chen L, et al. 2005. Hepatic gene expression discriminates responders and nonresponders in treatment of chronic hepatitis C viral infection. Gastroenterology 128:1437–1444 - PubMed
    1. Darnell JE, Jr, Kerr IM, Stark GR. 1994. Jak-STAT pathways and transcriptional activation in response to IFNs and other extracellular signaling proteins. Science 264:1415–1421 - PubMed
    1. Ferenci P, et al. 2005. Predicting sustained virological responses in chronic hepatitis C patients treated with peginterferon alfa-2a (40 KD)/ribavirin. J. Hepatol. 43:425–433 - PubMed

Publication types

Substances