. 2012 Aug;23(15):2982-92.
doi: 10.1091/mbc.E12-02-0135. Epub 2012 Jun 6.

Cot/tpl2-MKK1/2-Erk1/2 controls mTORC1-mediated mRNA translation in Toll-like receptor-activated macrophages

Affiliations

Cot/tpl2-MKK1/2-Erk1/2 controls mTORC1-mediated mRNA translation in Toll-like receptor-activated macrophages

Marta López-Pelaéz et al. Mol Biol Cell. 2012 Aug.

Abstract

Cot/tpl2 is the only MAP3K that activates MKK1/2-Erk1/2 in Toll-like receptor-activated macrophages. Here we show that Cot/tpl2 regulates RSK, S6 ribosomal protein, and 4E-BP phosphorylation after stimulation of bone marrow-derived macrophages with lipopolysaccharide (LPS), poly I:C, or zymosan. The dissociation of the 4E-BP-eIF4E complex, a key event in the cap-dependent mRNA translation initiation, is dramatically reduced in LPS-stimulated Cot/tpl2-knockout (KO) macrophages versus LPS-stimulated wild-type (Wt) macrophages. Accordingly, after LPS activation, increased cap-dependent translation is observed in Wt macrophages but not in Cot/tpl2 KO macrophages. In agreement with these data, Cot/tpl2 increases the polysomal recruitment of the 5´ TOP eEF1α and eEF2 mRNAs, as well as of inflammatory mediator gene-encoding mRNAs, such as tumor necrosis factor α (TNFα), interleukin-6 (IL-6), and KC in LPS-stimulated macrophages. In addition, Cot/tpl2 deficiency also reduces total TNFα, IL-6, and KC mRNA expression in LPS-stimulated macrophages, which is concomitant with a decrease in their mRNA half-lives. Macrophages require rapid fine control of translation to provide an accurate and not self-damaging response to host infection, and our data show that Cot/tpl2 controls inflammatory mediator gene-encoding mRNA translation in Toll-like receptor-activated macrophages.


Figures

FIGURE 1:
FIGURE 1:
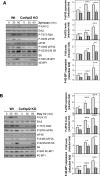
Cot/tpl2 governs the phosphorylation state of proteins involved in cap-dependent translation in LPS-stimulated BMDM. (A) Wt and Cot/tpl2 KO BMDM were stimulated with LPS (300 ng/ml), and after the indicated times Cot/tpl2, P-Erk1/2, P-T308 Akt, P-S473 Akt, P-S422 SGK1, P-T24 FOXO1, and P-S939 TSC2 levels were measured by Western blot. Erk2, Akt, SGK1, FOXO1, TSC2, and β-actin levels were determined as a protein loading control. Right, graphs represent the means ± SD from five independent experiments of P-T24 FOXO1 and P-S939 TSC2 fold induction relative to the Wt zero time point, after normalizing values to, respectively, total FOXO1 and total TSC2. (B) Cell extracts obtained as described in A were subjected to Western blot analysis using antibodies against the following phosphoproteins: P-T573 RSK, P-S1798 TSC2, P-T389 S6K1, P-S235/236 S6, and P-S366 eEF2k.The antibodies against total proteins used were RSK, TSC2, S6K1, S6, eEF2k, Erk2, and β-actin. The graphs represent the means ± SD from at least four independent experiments of P-T573 RSK, P-S1798 TSC2, P-S235/236 S6, and P-S366 eEF2k fold induction relative to the Wt zero time point, after normalizing values to, respectively, total RSK, TSC2, S6, and eEF2k. (C) Western blots of cell extracts obtained as described in A were probed against P-S65 4E-BP1, P-S209 eIF4E, 4E-BP1, eIF4E, and β-actin. Right, graphs represent the means ± SD from five independent experiments of P-S65 4E-BP1 and P-S209 eIF4E fold induction relative to the Wt zero time point, after normalizing values to, respectively, total 4E-BP1 and total eIF4E (A, B). Quantification of the induction fold of P-Erk1/2, P-T308 Akt, P-S473 Akt, P-S422 SGK1, and P-T389 S6K1 levels is shown in Supplemental Table S1.
FIGURE 2:
FIGURE 2:
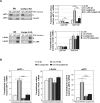
Erk1/2-dependent phosphorylation of P-S235/236 S6, P-S366 eEF2k, P-S65 4E-BP1, and P-S209 eIF4E in LPS-stimulated BMDM. (A) Wt and Cot/tpl2 KD BMDM were stimulated for different lengths of time with LPS (300 ng/ml), and the extracts obtained were analyzed by Western blots probed with the phospho antibodies against P-Erk1/2, P-S235/236 S6, P-S366 eEF2k, and P-S65 4E-BP1 and with antibodies against the total protein of Cot/tpl2, Erk2, S6, eEF2k, 4E-BP1, and eIF4E as loading controls. (B) Wt BMDMs were preincubated or not with the MKK1/2 inhibitor PD 0325901 (0.5 μM) for 60 min before stimulation with LPS (300 ng/ml) for the indicated times, after which the levels of P-Erk1/2, P-S235/236 S6, P-S366 eEF2k, P-S65 4E-BP1, and P-S209 eIF4E were determined by Western blot analysis. As a loading control, membranes were also blotted with the following antibodies: Erk2, S6, eEF2k, 4E-BP1, and eIF4E. (C) Wt BMDM were preincubated or not with the MKK1/2 inhibitor UO 126 (10 μM) or rapamycin (20 nM) for 60 min before stimulation with LPS (300 ng/ml) for the indicated times, after which the levels of P-Erk1/2, P-S65 4E-BP1, Erk2, and 4E-BP1 were determined by Western blot analysis. Graph represents the means ± SD from three independent experiments of P-S65 4E-BP1 fold induction relative to the Wt zero time point, after normalizing values to total 4E-BP1. For A–C, one representative experiment of the three independently performed is shown.
FIGURE 3:
FIGURE 3:
P-S65 4E-BP1 phosphorylation in Wt and Cot/tpl2 KO BMDM stimulated with zymosan or poly I:C. Wt and Cot/tpl2 KO BMDM were stimulated with zymosan (10 μg/ml; A) or with poly I:C (50 μg/ml; B) for 30 and 60 min and the expression levels of P-Erk1/2, P-T573 RSK, P-S209 eIF4E, P-S366 eEF2k, P-S235/236 S6, and P-S65 4E-BP1 were determined in Western blots. As a loading control the expression levels of Erk2, eIF4E, S6, and 4E-BP1 were also analyzed. For both A and B, one representative experiment of the three independently performed is shown. Right, graphs represent the means ± SD from five independent experiments of P-S209 eIF4E, eEF2k, P-S235/236 S6, and P-S65 4E-BP1 fold induction relative to the Wt zero time point, after normalizing values to, respectively, total eIF4E, Erk2, S6, and 4E-BP1.
FIGURE 4:
FIGURE 4:
Cot/tpl2 promotes dissociation of the 4E-BP1–eIF4E complex and cap-dependent translation. (A) Cell extracts from Wt and Cot/tpl2 KO BMDM stimulated or not for 1 or 2 h with LPS (300 ng/ml) were subjected to m7GTP–Sepharose bead pull-down assays, and the amount of 4E-BP1 bound to eIF4E was analyzed by Western blot. Expression levels of P-S65 4E-BP1, 4E-BP1, eIF4E, and Erk2 in total cell extracts are also shown. Representative experiments of the three independently performed are shown. Graph represents the means ± SD from three independent experiments of the 4E-BP1/eIF4E values, giving the value of 1 to the one obtained in Wt BMDM at zero point time. (B) Wt and Cot/tpl2 KO BMDM were nucleofected as indicated in Materials and Methods, with the biscitronic plasmid specified in the figure. Cells were harvested, and Renilla and Firefly luciferase luminescence was quantified using a luminometer. Graph represents the means ± SD from three independent experiments of Renilla/firefly luciferase values, giving the value of 1 to the one obtained in Wt BMDM at zero time point.
FIGURE 5:
FIGURE 5:
Cot/tpl2 regulates polysomal recruitment of eEF1α and eEF2 mRNA in LPS-stimulated BMDM. Cell lysates of Wt and Cot/tpl2 BMDM stimulated for 3 h or not with LPS (300 ng/ml) were subjected to sucrose gradient, and different RNA fractions were pooled. The RNA isolated from the different RNA fractions was subjected to Northern blot or qRT-PCR analysis. (A) Three mRNA fractions from the sucrose gradient were isolated: nontranslated mRNA (nonpolysomal components, consisting of nonpolysomal mRNAs and nontranslating free 40S and 60S ribosomal; NP), moderately translated mRNA (LMP), and actively translated mRNA (HMP). These mRNA fractions were subjected to Northern blot analysis. The eEF1α and β-actin mRNA expression in the NP, LMP, and HMP fractions of nonstimulated and 3-h LPS-stimulated Wt and Cot/tpl2 KO BMDM is shown. Right, graphs represent the means ± SD from five independent experiments of the quantification of the LMP/NP and HMP/NP eEF1α and β-actin mRNA ratios in the different cell conditions. (B) eEF1α, β-actin, and eEF2 mRNA expression in the nonpolysomal and polysomal fractions analyzed by qRT-PCR. Graphs represent the means ± SD from five independent experiments of the quantification of the polysome/nonpolysome mRNA ratio in the different cell conditions.
FIGURE 6:
FIGURE 6:
Cot/tpl2 controls TNFα, KC, and IL-6 production and polysomal recruitment of their mRNAs in LPS-stimulated BMDM. (A) The concentration of TNFα, IL-6, and KC in the supernatant of Wt and Cot/tpl2 KO BMDM stimulated or not for 3 or 8 h with LPS (300 ng/ml) was determined using a Luminex 100 system (Upstate, Millipore, Billerica, MA), according to the manufacturer's instructions. Graphs show the means ± SD from three independent experiments. (B) TNFα, KC, and IL-6 mRNA expression in the nonpolysomal and polysomal RNA fractions described in Figure 5B was analyzed by qRT-PCR. Graphs represent the means ± SD from five independent experiments of the quantification of the polysome/nonpolysome mRNA ratio in the different cell conditions.
FIGURE 7:
FIGURE 7:
Cot/tpl2 controls TNFα, KC, and IL-6 mRNA stability in LPS-stimulated BMDM. (A) Total RNA from Wt and Cot/tpl2 KO BMDM stimulated or not for 3 h with LPS (300 ng/ml) was extracted, and TNFα, KC, and IL-6 mRNA expression was determined by qRT-PCR analysis. TNFα, KC, and IL-6 expression levels were normalized to levels of 18Sr mRNA expression in each assay. Graphs show the mean ± SD from five independent experiments, giving the value of 1 to the one obtained in control Wt BMDM. (B) The stability of TNFα, KC, IL-6, and β-actin mRNA in 3-h LPS-stimulated Wt and Cot/tpl2 KO BMDM was determined. Wt and Cot/tpl2 KO BMDM were stimulated for 3 h with LPS (300 ng/ml), and then actinomycin D (5 μg/ml) was added. At the indicated times cells were lysed, and subsequently the TNFα, IL-6, KC, and β-actin mRNA levels were analyzed by qRT-PCR and normalized by the expression of 18Sr mRNA. Graphs shown the means ± SD from three independent experiments, giving the value of 100% to the normalized mRNA levels obtained for Wt BMDM 3 h after the LPS stimulation.

Similar articles

Cited by

References

    1. Akira S, Takeda K. Toll-like receptor signalling. Nat Rev Immunol. 2004;4:499–511. - PubMed
    1. Anderson P. Post-transcriptional control of cytokine production. Nat Immunol. 2008;9:353–359. - PubMed
    1. Anderson P. Post-transcriptional regulons coordinate the initiation and resolution of inflammation. Nat Rev Immunol. 2010;10:24–35. - PubMed
    1. Anjum R, Blenis J. The RSK family of kinases: emerging roles in cellular signalling. Nat Rev Mol Cell Biol. 2008;9:747–758. - PubMed
    1. Bain J, Plater L, Elliott M, Shpiro N, Hastie CJ, McLauchlan H, Klevernic I, Arthur JS, Alessi DR, Cohen P. The selectivity of protein kinase inhibitors: a further update. Biochem J. 2007;408:297–315. - PMC - PubMed

Publication types