

Cyclic AMP regulates formation of mammary epithelial acini in vitro
- PMID: 22675028
- PMCID: PMC3408423
- DOI: 10.1091/mbc.E12-02-0078
Cyclic AMP regulates formation of mammary epithelial acini in vitro
Abstract
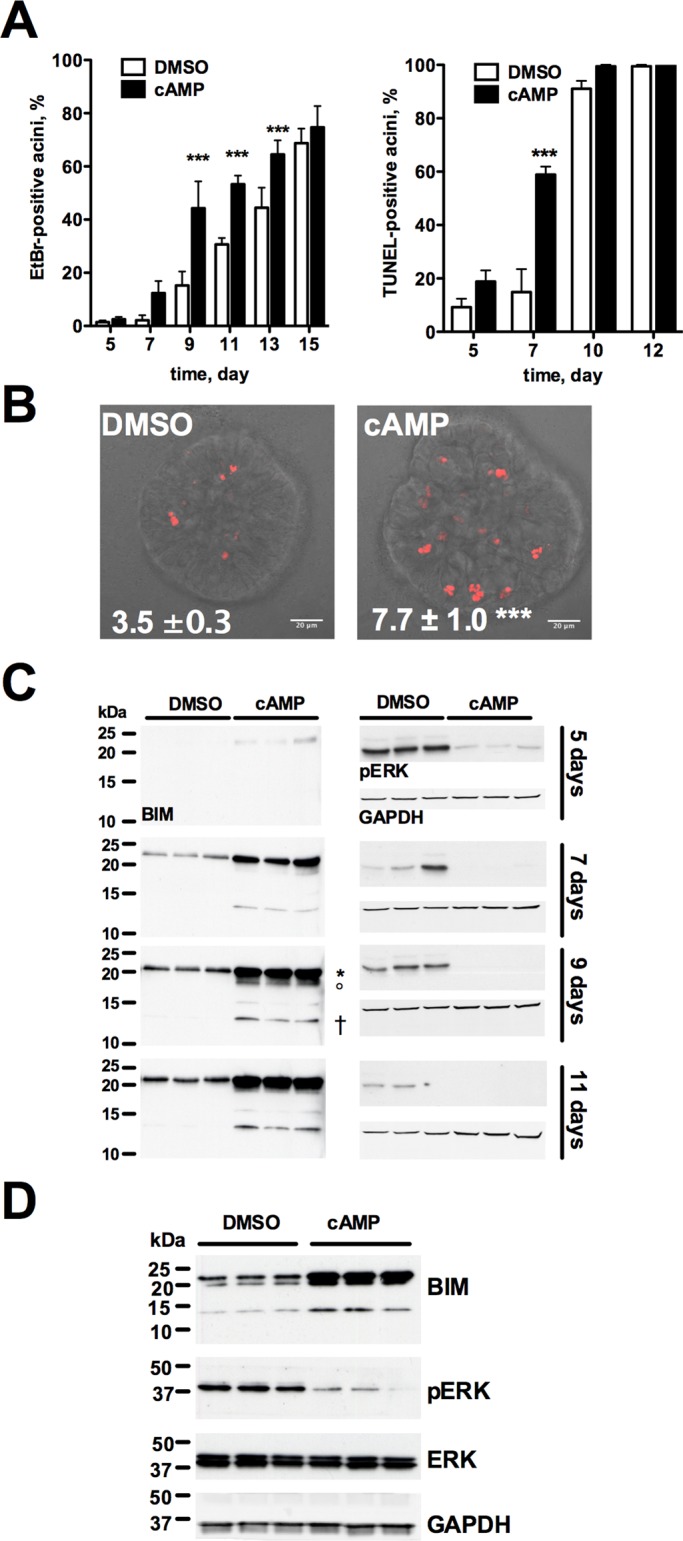
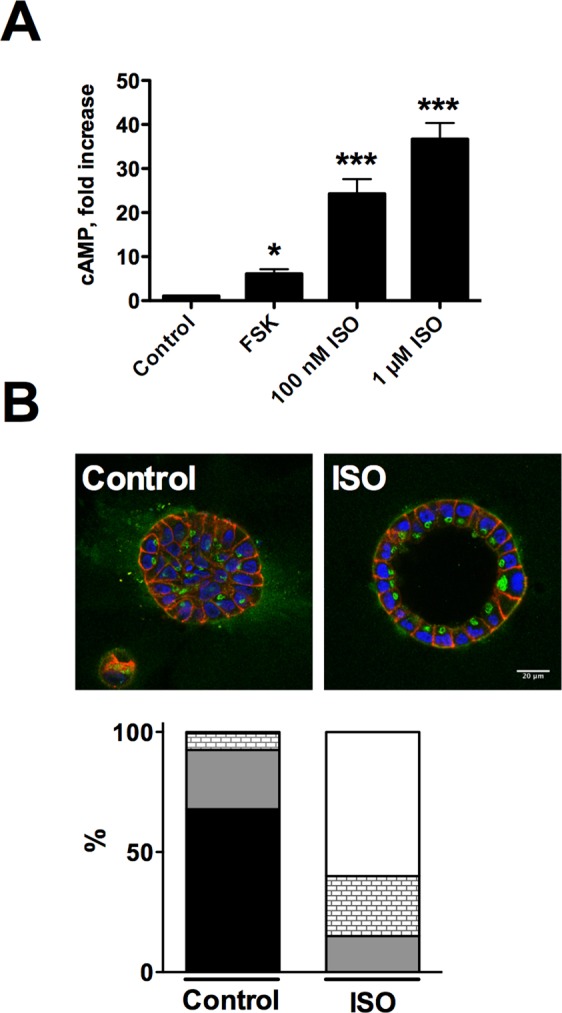
Epithelial cells form tubular and acinar structures notable for a hollow lumen. In three-dimensional culture utilizing MCF10A mammary epithelial cells, acini form due to integrin-dependent polarization and survival of cells contacting extracellular matrix (ECM), and the apoptosis of inner cells of acini lacking contact with the ECM. In this paper, we report that cyclic AMP (cAMP)-dependent protein kinase A (PKA) promotes acinus formation via two mechanisms. First, cAMP accelerates redistribution of α6-integrin to the periphery of the acinus and thus facilitates the polarization of outer acinar cells. Blocking of α6-integrin function by inhibitory antibody prevents cAMP-dependent polarization. Second, cAMP promotes the death of inner cells occupying the lumen. In the absence of cAMP, apoptosis is delayed, resulting in perturbed luminal clearance. cAMP-dependent apoptosis is accompanied by a posttranscriptional PKA-dependent increase in the proapoptotic protein Bcl-2 interacting mediator of cell death. These data demonstrate that cAMP regulates lumen formation in mammary epithelial cells in vitro, both through acceleration of polarization of outer cells and apoptosis of inner cells of the acinus.
Figures


Similar articles
-
Bim regulation of lumen formation in cultured mammary epithelial acini is targeted by oncogenes.Mol Cell Biol. 2005 Jun;25(11):4591-601. doi: 10.1128/MCB.25.11.4591-4601.2005. Mol Cell Biol. 2005. PMID: 15899862 Free PMC article.
-
Increased extracellular matrix density decreases MCF10A breast cell acinus formation in 3D culture conditions.J Tissue Eng Regen Med. 2016 Jan;10(1):71-80. doi: 10.1002/term.1675. Epub 2013 Feb 12. J Tissue Eng Regen Med. 2016. PMID: 23404906
-
Hypoxia suppression of Bim and Bmf blocks anoikis and luminal clearing during mammary morphogenesis.Mol Biol Cell. 2010 Nov 15;21(22):3829-37. doi: 10.1091/mbc.E10-04-0353. Epub 2010 Sep 22. Mol Biol Cell. 2010. PMID: 20861305 Free PMC article.
-
Lumen formation during mammary epithelial morphogenesis: insights from in vitro and in vivo models.Cell Cycle. 2008 Jan 1;7(1):57-62. doi: 10.4161/cc.7.1.5150. Epub 2007 Oct 9. Cell Cycle. 2008. PMID: 18196964 Review.
-
Cyclic AMP/PKA-promoted apoptosis: insights from studies of S49 lymphoma cells.Horm Metab Res. 2014 Nov;46(12):854-62. doi: 10.1055/s-0034-1384519. Epub 2014 Jul 16. Horm Metab Res. 2014. PMID: 25028794 Review.
Cited by
-
Mammary duct luminal epithelium controls adipocyte thermogenic programme.Nature. 2023 Aug;620(7972):192-199. doi: 10.1038/s41586-023-06361-5. Epub 2023 Jul 26. Nature. 2023. PMID: 37495690 Free PMC article.
-
Hallmarks and Determinants of Oncogenic Translation Revealed by Ribosome Profiling in Models of Breast Cancer.Transl Oncol. 2020 Feb;13(2):452-470. doi: 10.1016/j.tranon.2019.12.002. Epub 2020 Jan 3. Transl Oncol. 2020. PMID: 31911279 Free PMC article.
-
Connexin 43 maintains tissue polarity and regulates mitotic spindle orientation in the breast epithelium.J Cell Sci. 2019 May 16;132(10):jcs223313. doi: 10.1242/jcs.223313. J Cell Sci. 2019. PMID: 30992345 Free PMC article.
-
Bacillus anthracis Edema Toxin Increases Fractional Free Water and Sodium Reabsorption in an Isolated Perfused Rat Kidney Model.Infect Immun. 2017 Jun 20;85(7):e00264-17. doi: 10.1128/IAI.00264-17. Print 2017 Jul. Infect Immun. 2017. PMID: 28438974 Free PMC article.
-
A Novel Effect of β-Adrenergic Receptor on Mammary Branching Morphogenesis and its Possible Implications in Breast Cancer.J Mammary Gland Biol Neoplasia. 2017 Mar;22(1):43-57. doi: 10.1007/s10911-017-9371-1. Epub 2017 Jan 11. J Mammary Gland Biol Neoplasia. 2017. PMID: 28074314
References
-
- Cheng P-L, Lu H, Shelly M, Gao H, Poo M-M. Phosphorylation of E3 ligase Smurf1 switches its substrate preference in support of axon development. Neuron. 2011;69:231–243. - PubMed
-
- Debnath J, Brugge JS. Modelling glandular epithelial cancers in three-dimensional cultures. Nat Rev Cancer. 2005;5:675–688. - PubMed
-
- Debnath J, Mills KR, Collins NL, Reginato MJ, Muthuswamy SK, Brugge JS. The role of apoptosis in creating and maintaining luminal space within normal and oncogene-expressing mammary acini. Cell. 2002;111:29–40. - PubMed
Publication types
MeSH terms
Substances
Grants and funding
LinkOut - more resources
Full Text Sources
Other Literature Sources
Miscellaneous
