. 2012 Jul;40(Web Server issue):W491-7.
doi: 10.1093/nar/gks490. Epub 2012 Jun 6.

KOMODO: a web tool for detecting and visualizing biased distribution of groups of homologous genes in monophyletic taxa

Affiliations

KOMODO: a web tool for detecting and visualizing biased distribution of groups of homologous genes in monophyletic taxa

Francisco P Lobo et al. Nucleic Acids Res. 2012 Jul.

Abstract

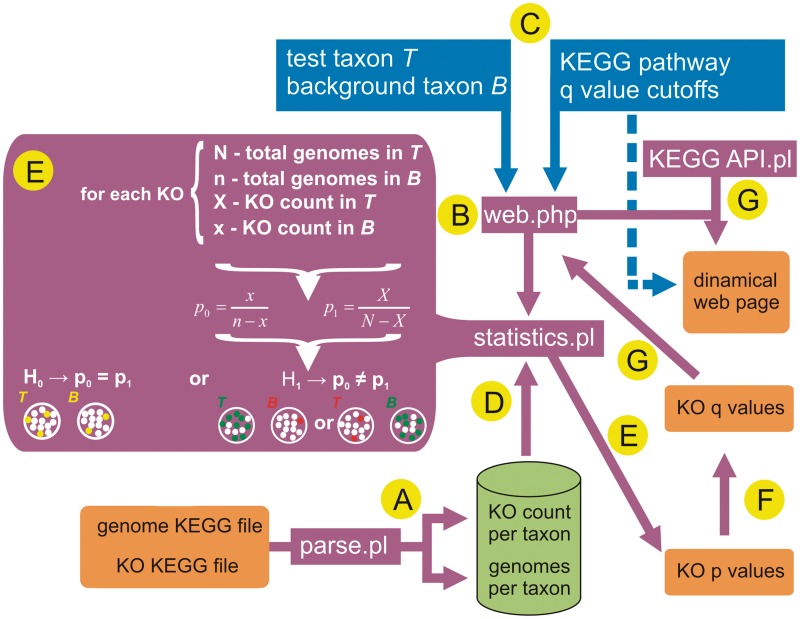
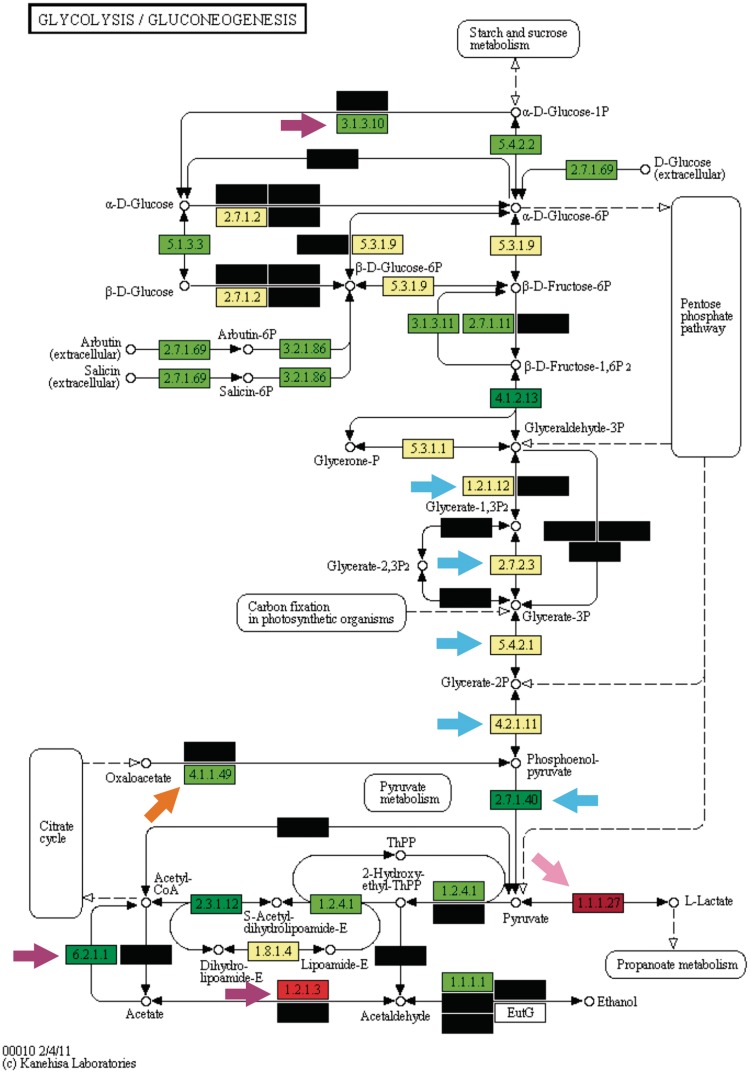
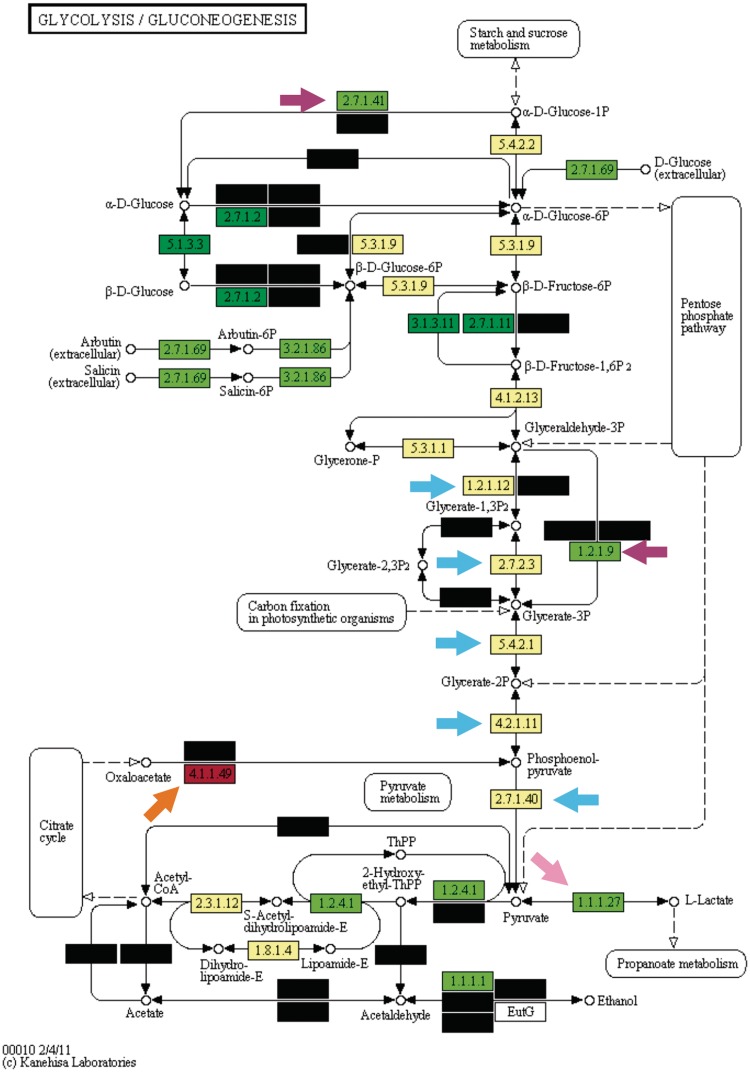
The enrichment analysis is a standard procedure to interpret 'omics' experiments that generate large gene lists as outputs, such as transcriptomics and protemics. However, despite the huge success of enrichment analysis in these classes of experiments, there is a surprising lack of application of this methodology to survey other categories of large-scale biological data available. Here, we report Kegg Orthology enrichMent-Online DetectiOn (KOMODO), a web tool to systematically investigate groups of monophyletic genomes in order to detect significantly enriched groups of homologous genes in one taxon when compared with another. The results are displayed in their proper biochemical roles in a visual, explorative way, allowing users to easily formulate and investigate biological hypotheses regarding the taxonomical distribution of genomic elements. We validated KOMODO by analyzing portions of central carbon metabolism in two taxa extensively studied regarding their carbon metabolism profile (Enterobacteriaceae family and Lactobacillales order). Most enzymatic activities significantly biased were related to known key metabolic traits in these taxa, such as the distinct fates of pyruvate (the known tendency of lactate production in Lactobacillales and its complete oxidation in Enterobacteriaceae), demonstrating that KOMODO could detect biologically meaningful differences in the frequencies of shared genomic elements among taxa. KOMODO is freely available at http://komodotool.org.


Figures

Figure 1.
Figure 1.
Pipeline used for implementation of KOMODO. Orange boxes denote flat files from KEGG or generated by KOMODO. Purple boxes represent programs developed in this study. Green cylinder represents the relational database generated for this study. Blue boxes indicate the user-supplied information needed for KO enrichment analysis. The sequential steps for analysis are highlighted by yellow dots. (A) Parsing of KEGG information to generate KO count and genome number per taxa; data stored in a local relational database. (B) Program ‘web.php’ coordinates the entire pipeline by getting user-defined parameters (step C) to search in the relational database (step D), make the statistical testing (steps E, F and G), and generate a dynamic webpage and a flat file as final results (step G).
Figure 2.
Figure 2.
KEGG Orthology enrichment analysis of the glycolytic pathway in the ENT group. Yellow boxes denote KOs where no difference was observed between test and background taxa. Black boxes denote KOs not observed in test or background taxa. Green and red boxes denote KOs significantly more and less represented in the test lineage when compared with the background one, respectively. Darker and lighter tones of both green and red boxes denote q-values between 0.05 and 0.00001 and smaller than 0.00001, respectively. Blue, pink, orange and purple arrows indicate trunk glycolysis enzymes, l-lactate dehydrogenase, PEP carboxykinase and taxon-specific enzymatic activities, respectively.
Figure 3.
Figure 3.
KEGG Orthology enrichment analysis of the glycolytic pathway in the LAB group. The color schema and q-value cut-offs are the same as utilized in Figure 2.

Similar articles

Cited by

References

    1. Subramanian A, Tamayo P, Mootha VK, Mukherjee S, Ebert BL, Gillette MA, Paulovich A, Pomeroy SL, Golub TR, Lander ES, et al. Gene set enrichment analysis: a knowledge-based approach for interpreting genome-wide expression profiles. Proc. Natl Acad. Sci. USA. 2005;102:15545–15550. - PMC - PubMed
    1. Huang da W, Sherman BT, Lempicki RA. Bioinformatics enrichment tools: paths toward the comprehensive functional analysis of large gene lists. Nucleic Acids Res. 2009;37:1–13. - PMC - PubMed
    1. Cai Z, Mao X, Li S, Wei L. Genome comparison using Gene Ontology (GO) with statistical testing. BMC Bioinformatics. 2006;7:374. - PMC - PubMed
    1. Weng MP, Liao BY. MamPhEA: a web tool for mammalian phenotype enrichment analysis. Bioinformatics. 2010;26:2212–2213. - PMC - PubMed
    1. McLeay RC, Bailey TL. Motif enrichment analysis: a unified framework and an evaluation on ChIP data. BMC bioinformatics. 2010;11:165. - PMC - PubMed

Publication types