

Integration of Hi-C and ChIP-seq data reveals distinct types of chromatin linkages
- PMID: 22675074
- PMCID: PMC3439894
- DOI: 10.1093/nar/gks501
Integration of Hi-C and ChIP-seq data reveals distinct types of chromatin linkages
Abstract
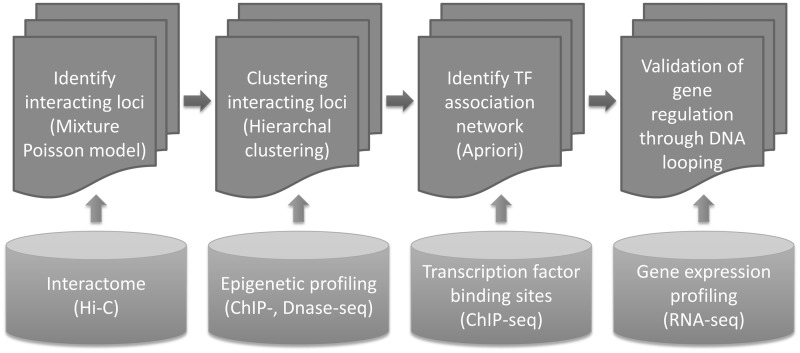
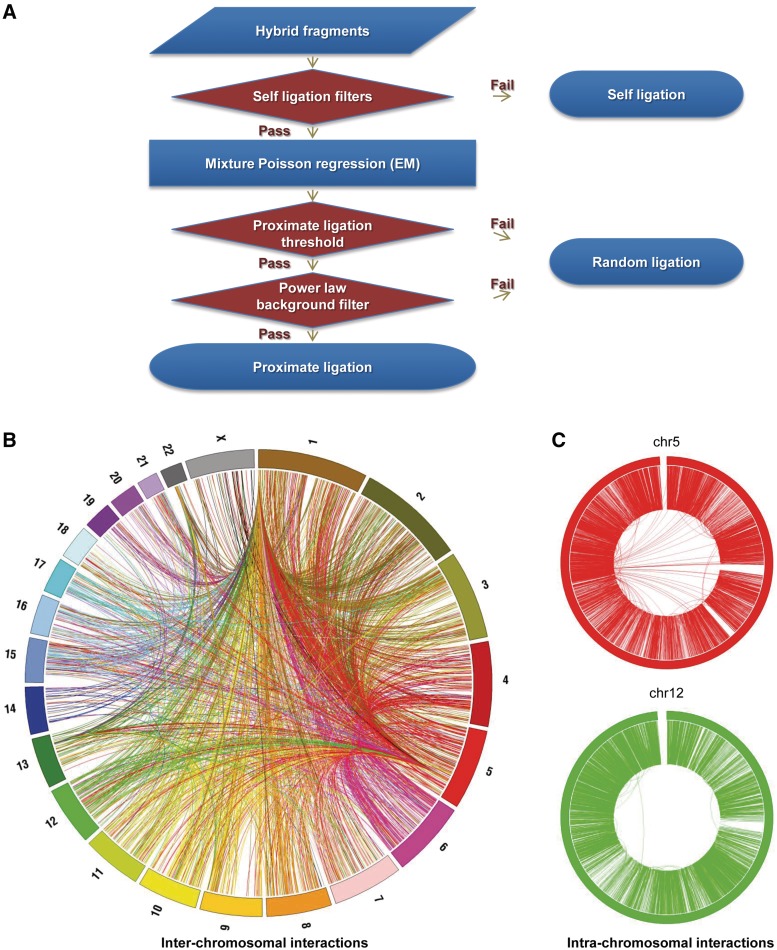
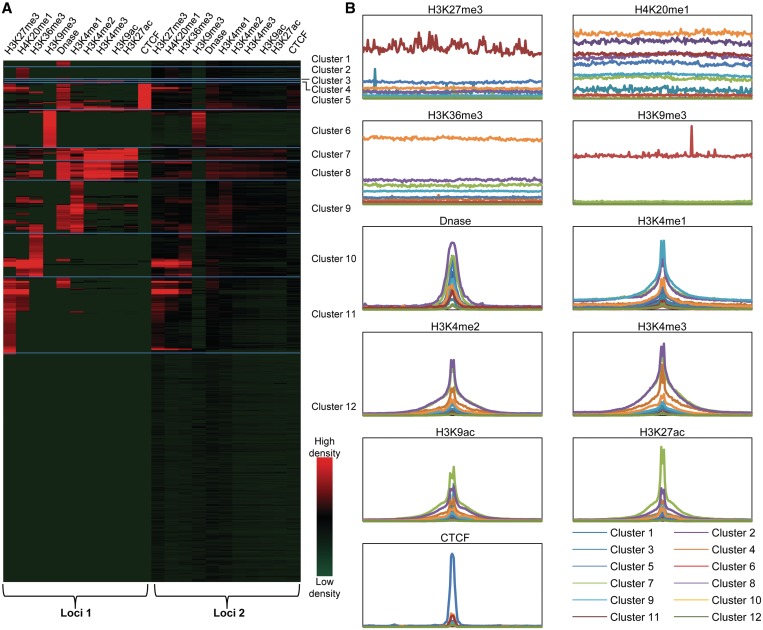
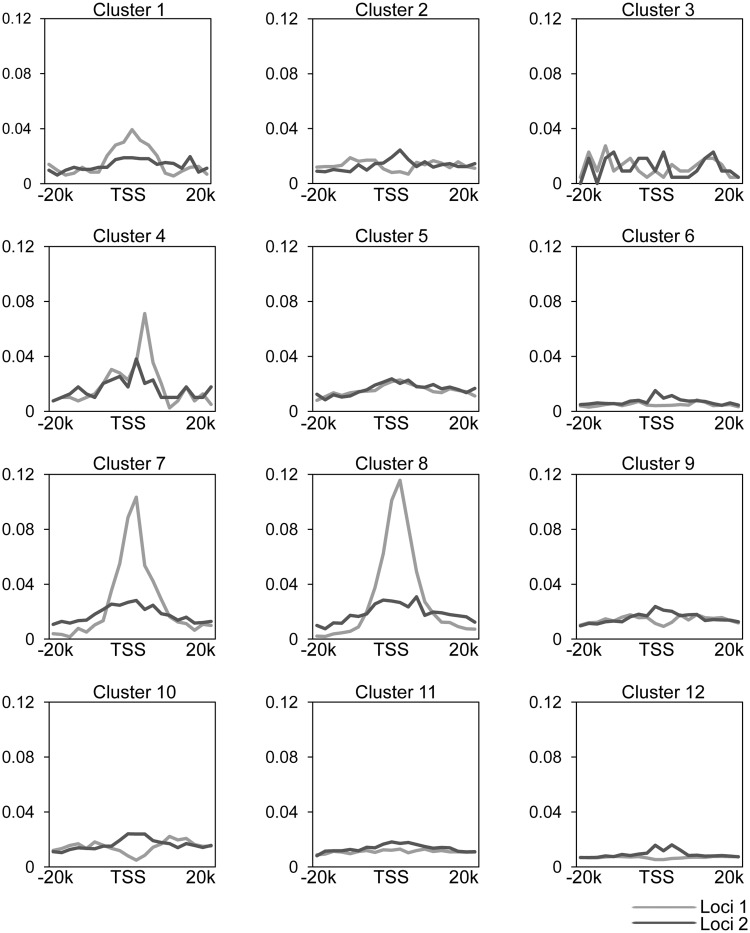
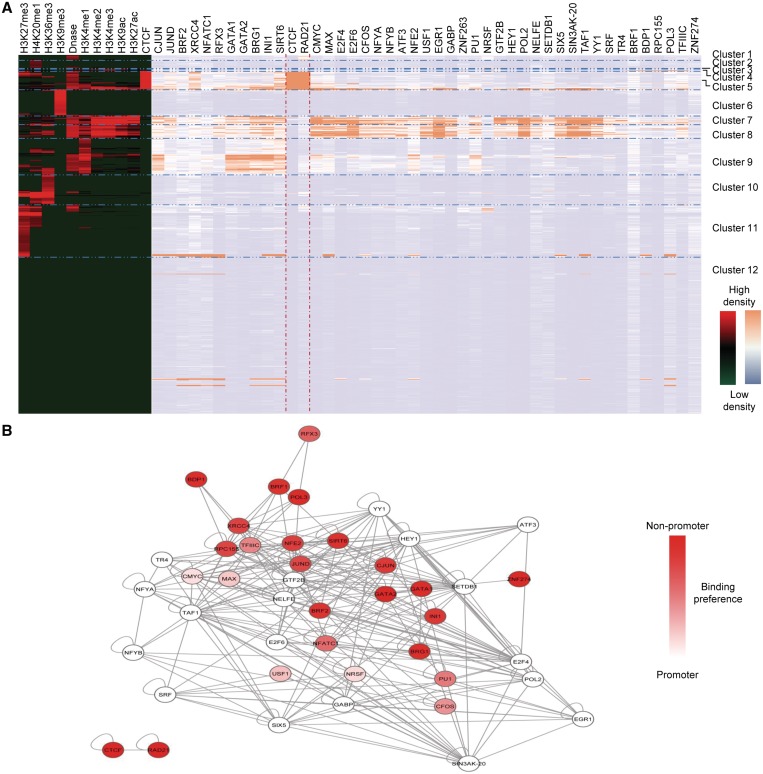
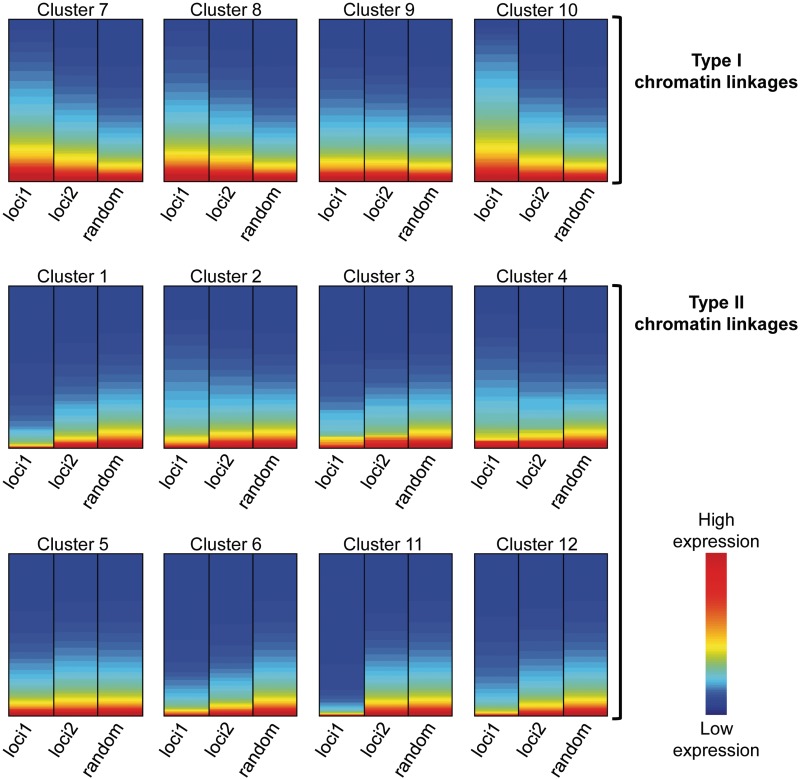
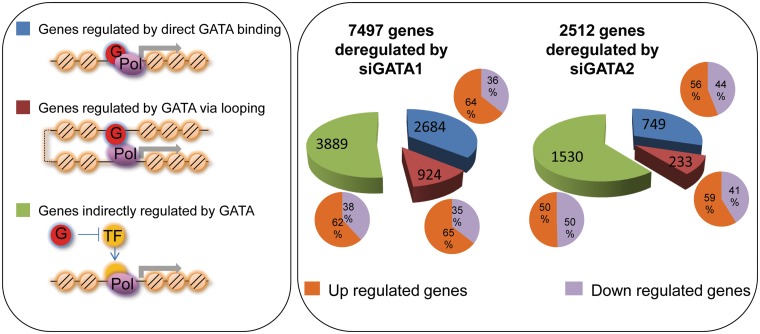
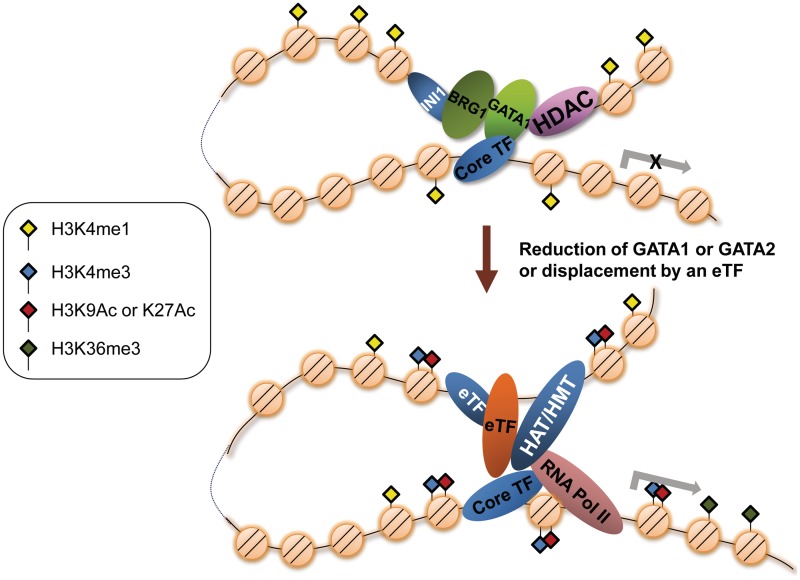
We have analyzed publicly available K562 Hi-C data, which enable genome-wide unbiased capturing of chromatin interactions, using a Mixture Poisson Regression Model and a power-law decay background to define a highly specific set of interacting genomic regions. We integrated multiple ENCODE Consortium resources with the Hi-C data, using DNase-seq data and ChIP-seq data for 45 transcription factors and 9 histone modifications. We classified 12 different sets (clusters) of interacting loci that can be distinguished by their chromatin modifications and which can be categorized into two types of chromatin linkages. The different clusters of loci display very different relationships with transcription factor-binding sites. As expected, many of the transcription factors show binding patterns specific to clusters composed of interacting loci that encompass promoters or enhancers. However, cluster 9, which is distinguished by marks of open chromatin but not by active enhancer or promoter marks, was not bound by most transcription factors but was highly enriched for three transcription factors (GATA1, GATA2 and c-Jun) and three chromatin modifiers (BRG1, INI1 and SIRT6). To investigate the impact of chromatin organization on gene regulation, we performed ribonucleicacid-seq analyses before and after knockdown of GATA1 or GATA2. We found that knockdown of the GATA factors not only alters the expression of genes having a nearby bound GATA but also affects expression of genes in interacting loci. Our work, in combination with previous studies linking regulation by GATA factors with c-Jun and BRG1, provides genome-wide evidence that Hi-C data identify sets of biologically relevant interacting loci.
Figures
Similar articles
-
Genome-Wide Analysis of the Distinct Types of Chromatin Interactions in Arabidopsis thaliana.Plant Cell Physiol. 2017 Jan 1;58(1):57-70. doi: 10.1093/pcp/pcw194. Plant Cell Physiol. 2017. PMID: 28064247
-
Clustered ChIP-Seq-defined transcription factor binding sites and histone modifications map distinct classes of regulatory elements.BMC Biol. 2011 Nov 24;9:80. doi: 10.1186/1741-7007-9-80. BMC Biol. 2011. PMID: 22115494 Free PMC article.
-
Enhancer identification in mouse embryonic stem cells using integrative modeling of chromatin and genomic features.BMC Genomics. 2012 Apr 26;13:152. doi: 10.1186/1471-2164-13-152. BMC Genomics. 2012. PMID: 22537144 Free PMC article.
-
Role of ChIP-seq in the discovery of transcription factor binding sites, differential gene regulation mechanism, epigenetic marks and beyond.Cell Cycle. 2014;13(18):2847-52. doi: 10.4161/15384101.2014.949201. Cell Cycle. 2014. PMID: 25486472 Free PMC article. Review.
-
Evaluating Enhancer Function and Transcription.Annu Rev Biochem. 2020 Jun 20;89:213-234. doi: 10.1146/annurev-biochem-011420-095916. Epub 2020 Mar 20. Annu Rev Biochem. 2020. PMID: 32197056 Review.
Cited by
-
Transcription factor binding at enhancers: shaping a genomic regulatory landscape in flux.Front Genet. 2012 Sep 28;3:195. doi: 10.3389/fgene.2012.00195. eCollection 2012. Front Genet. 2012. PMID: 23060900 Free PMC article.
-
Mapping nucleosome and chromatin architectures: A survey of computational methods.Comput Struct Biotechnol J. 2022 Jul 26;20:3955-3962. doi: 10.1016/j.csbj.2022.07.037. eCollection 2022. Comput Struct Biotechnol J. 2022. PMID: 35950186 Free PMC article. Review.
-
CREBBP/EP300 bromodomains are critical to sustain the GATA1/MYC regulatory axis in proliferation.Epigenetics Chromatin. 2018 Jun 8;11(1):30. doi: 10.1186/s13072-018-0197-x. Epigenetics Chromatin. 2018. PMID: 29884215 Free PMC article.
-
Transcriptional regulation and spatial interactions of head-to-head genes.BMC Genomics. 2014 Jun 24;15(1):519. doi: 10.1186/1471-2164-15-519. BMC Genomics. 2014. PMID: 24962804 Free PMC article.
-
The transcription factor GATA1 regulates NBEAL2 expression through a long-distance enhancer.Haematologica. 2017 Apr;102(4):695-706. doi: 10.3324/haematol.2016.152777. Epub 2017 Jan 12. Haematologica. 2017. PMID: 28082341 Free PMC article.
References
-
- Li B, Carey M, Workman JL. The role of chromatin during transcription. Cell. 2007;128:707–719. - PubMed
-
- Heintzman ND, Stuart RK, Hon G, Fu Y, Ching CW, Hawkins RD, Barrera LO, Van Calcar S, Qu C, Ching KA, et al. Distinct and predictive chromatin signatures of transcriptional promoters and enhancers in the human genome. Nat. Genet. 2007;39:311–318. - PubMed
-
- Barski A, Cuddapah S, Cui K, Roh TY, Schones DE, Wang Z, Wei G, Chepelev I, Zhao K. High-resolution profiling of histone methylations in the human genome. Cell. 2007;129:823–837. - PubMed
-
- Boyer LA, Plath K, Zeitlinger J, Brambrink T, Medeiros LA, Lee TI, Levine SS, Wernig M, Tajonar A, Ray MK, et al. Polycomb complexes repress developmental regulators in murine embryonic stem cells. Nature. 2006;441:349–353. - PubMed
Publication types
MeSH terms
Substances
Associated data
- Actions
Grants and funding
LinkOut - more resources
Full Text Sources
Other Literature Sources
Molecular Biology Databases
Research Materials
Miscellaneous
