

T-REX: a web server for inferring, validating and visualizing phylogenetic trees and networks
- PMID: 22675075
- PMCID: PMC3394261
- DOI: 10.1093/nar/gks485
T-REX: a web server for inferring, validating and visualizing phylogenetic trees and networks
Abstract
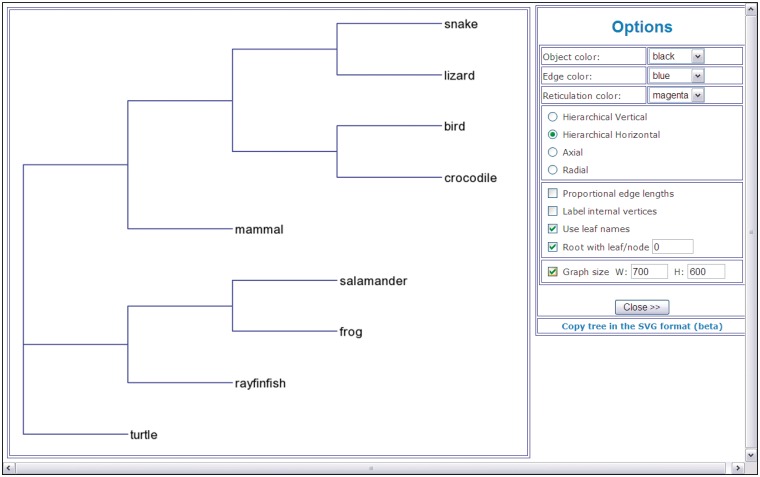
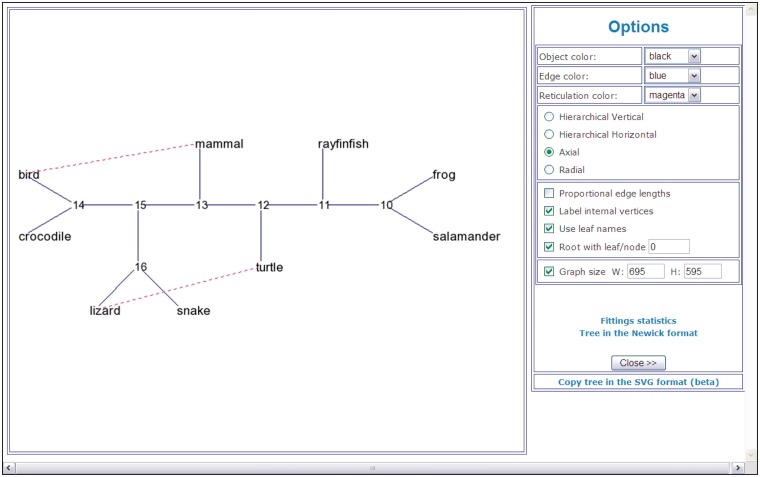
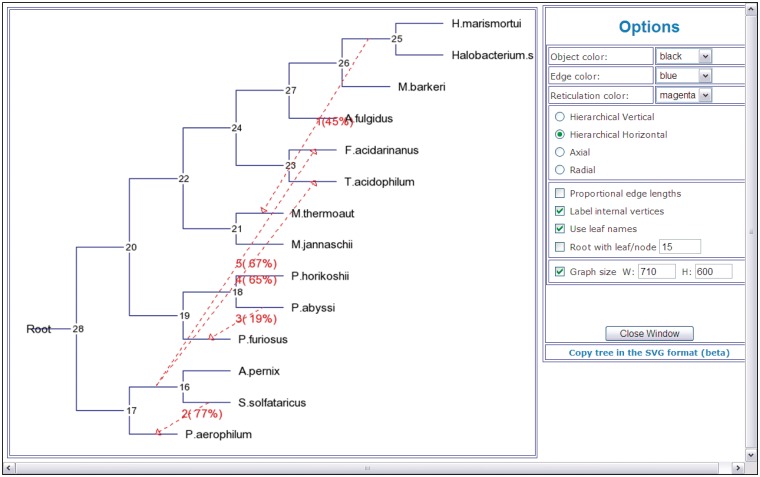
T-REX (Tree and reticulogram REConstruction) is a web server dedicated to the reconstruction of phylogenetic trees, reticulation networks and to the inference of horizontal gene transfer (HGT) events. T-REX includes several popular bioinformatics applications such as MUSCLE, MAFFT, Neighbor Joining, NINJA, BioNJ, PhyML, RAxML, random phylogenetic tree generator and some well-known sequence-to-distance transformation models. It also comprises fast and effective methods for inferring phylogenetic trees from complete and incomplete distance matrices as well as for reconstructing reticulograms and HGT networks, including the detection and validation of complete and partial gene transfers, inference of consensus HGT scenarios and interactive HGT identification, developed by the authors. The included methods allows for validating and visualizing phylogenetic trees and networks which can be built from distance or sequence data. The web server is available at: www.trex.uqam.ca.
Figures
References
-
- Felsenstein J. Inferring Phylogenies. Sinauer Associates: Sunderland, MA; 2004.
-
- Sneath PHA, Sokal RR. In: Numerical taxonomy — The Principles and Practice of Numerical Classification. Freeman WH, editor. San Francisco, CA; 1973.
-
- Hennig W. In: Phylogenetic Systematics. Dwight Davis D, Zangerl Rainer, translators. Urbana, IL: University of Illinois Press; 1966.
-
- Legendre P. Special section on reticulate evolution. J. Classif. 2000;17:153–195.
-
- Huson DH, Bryant D. Application of phylogenetic networks in evolutionary studies. Mol. Biol. Evol. 2006;23:254–267. - PubMed
Publication types
MeSH terms
LinkOut - more resources
Full Text Sources
