. 2012 Jul;139(14):2547-56.
doi: 10.1242/dev.079863. Epub 2012 Jun 6.

An E-cadherin-mediated hitchhiking mechanism for C. elegans germ cell internalization during gastrulation

Affiliations

An E-cadherin-mediated hitchhiking mechanism for C. elegans germ cell internalization during gastrulation

Daisuke Chihara et al. Development. 2012 Jul.

Abstract

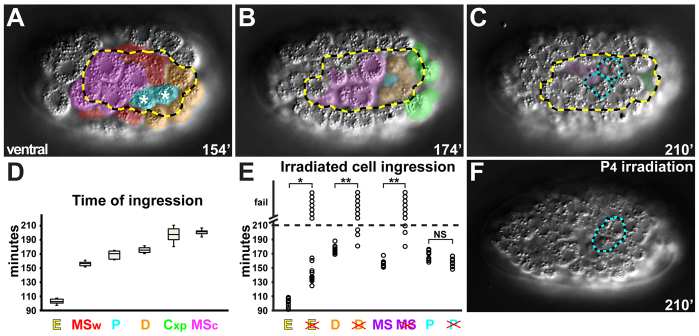
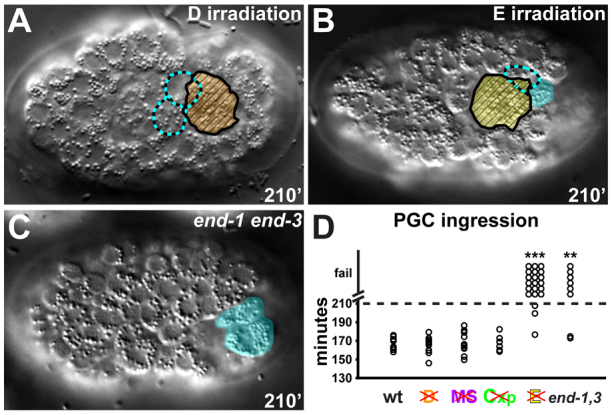
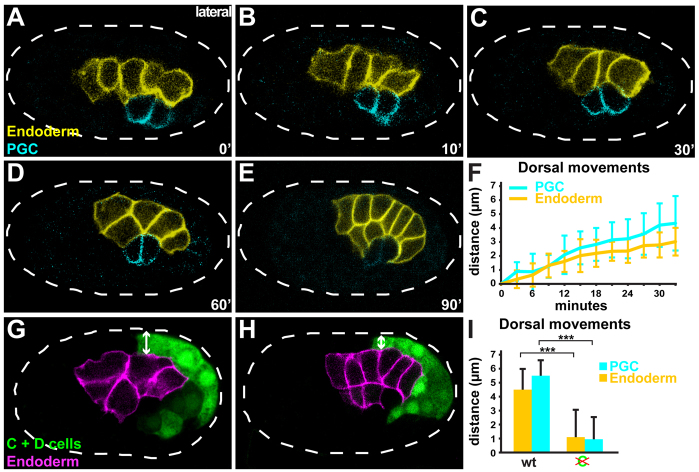
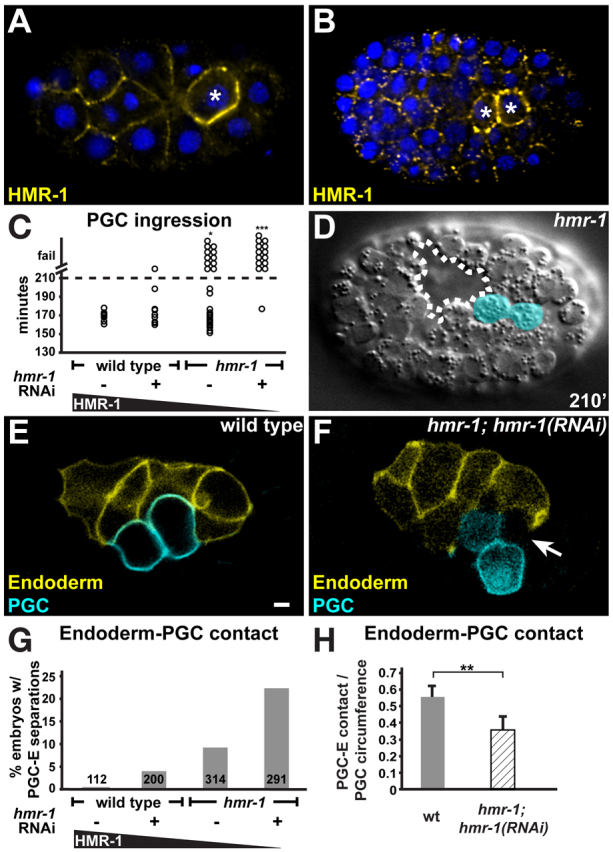
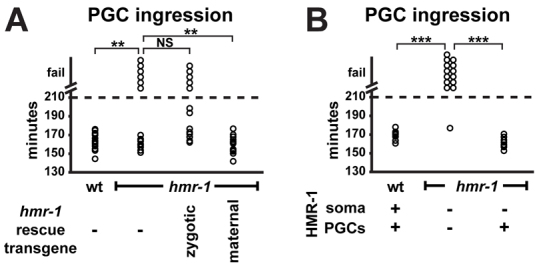
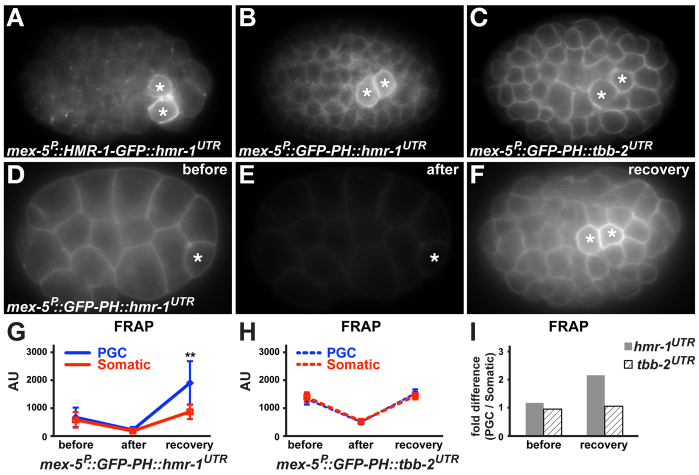
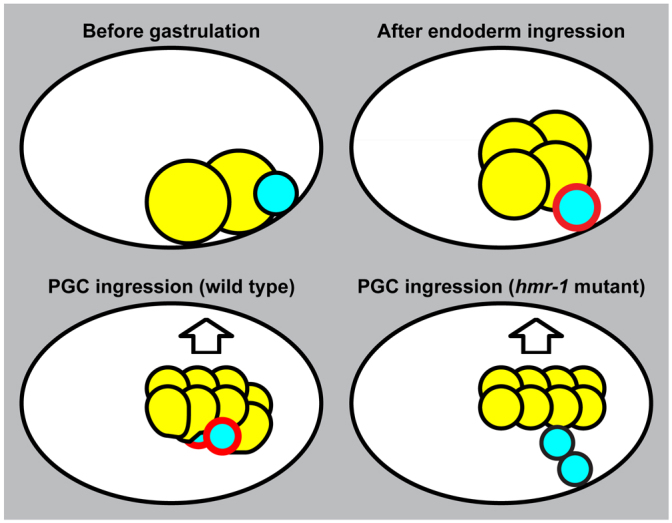
Gastrulation movements place endodermal precursors, mesodermal precursors and primordial germ cells (PGCs) into the interior of the embryo. Somatic cell gastrulation movements are regulated by transcription factors that also control cell fate, coupling cell identity and position. By contrast, PGCs in many species are transcriptionally quiescent, suggesting that they might use alternative gastrulation strategies. Here, we show that C. elegans PGCs internalize by attaching to internal endodermal cells, which undergo morphogenetic movements that pull the PGCs into the embryo. We show that PGCs enrich HMR-1/E-cadherin at their surfaces to stick to endoderm. HMR-1 expression in PGCs is necessary and sufficient to ensure internalization, suggesting that HMR-1 can promote PGC-endoderm adhesion through a mechanism other than homotypic trans interactions between the two cell groups. Finally, we demonstrate that the hmr-1 3' untranslated region promotes increased HMR-1 translation in PGCs. Our findings reveal that quiescent PGCs employ a post-transcriptionally regulated hitchhiking mechanism to internalize during gastrulation, and demonstrate a morphogenetic role for the conserved association of PGCs with the endoderm.


Figures

Fig. 1.
Fig. 1.
PGC ingression and interacting cells. Embryos (~50 μm in length) are oriented anterior towards the left and are shown from the indicated perspective. (A-C) Time-lapse stills of a wild-type embryo. Time is in minutes after first cleavage. Cell lineages are color-coded (PGCs, cyan; MSw, red; MSc, magenta; E, yellow; D, orange; Cxp, green). Ingressing cells in deeper focal planes are shown in more transparent colors, and out-of-focus internalized cells are indicated by dashed borders. (A) An ~100-cell stage embryo, just before PGC ingression; asterisks mark the two PGCs. (B) An ~190-cell stage embryo, PGC ingression. (C) ~200-cell stage, ingression of PGCs and cells in MS, D, E and Cxp lineages is complete. (D) Quantification of ingression times of the indicated lineage in wild-type embryos (n=10). The median (line in box), 25th and 75th percentiles (box boundary), and s.d. (error bars) are shown. (E) Ingression of cells in indicated lineages following laser irradiation (E wild type, n=17; E irradiated, n=21; D wild type, n=10; D irradiated n=10; MS wild type, n=10; MS irradiated, n=10; P4 wild type, n=10; P4 irradiated, n=11). In this and subsequent figures, circles indicate cell ingression times in individual embryos; circles above the dashed line indicate that cells failed to ingress by 210 minutes, when movies were stopped. Asterisks indicate a significant difference in whether or not PGCs ingressed relative to unirradiated controls (Fisher's exact test, *P<0.05, **P<0.01; NS, not significant). (F) PGC ingression following P4 laser irradiation. The position of the internalized P4 corpse is indicated with dashed cyan outlines.
Fig. 2.
Fig. 2.
Requirement of interacting cells for PGC ingression. (A-C) Embryos (~50 μm in length) are oriented anterior towards the left and are shown from the ventral perspective. PGC ingression following D irradiation (A), E irradiation (B) and in end-1 end-3 mutant embryos (C). PGCs, cyan; E, yellow; D, orange. The position of internalized PGCs is indicated with dashed cyan outlines, while PGCs that failed to ingress are shaded in cyan. The corpse of the irradiated cell remaining on the surface is indicated with hatched fill. (D) Ingression of PGCs in laser-irradiated and mutant embryos (wild-type, n=10; D irradiation, n=12; MS irradiation, n=11; Cxp irradiation, n=6; E irradiation, n=21; end-1 end-3, n=8). Asterisks indicate a significant difference in whether PGCs ingressed relative to unirradiated controls (Fisher's exact test, **P<0.01, ***P<0.001).
Fig. 3.
Fig. 3.
PGC ingression and dorsal movements of endodermal cells. Embryos (~50 μm in length) are oriented anterior towards the left and are shown from the lateral perspective. (A-E) Time-lapse stills of a wild-type embryo expressing PGC-specific (pie-1P::GFP-PAR-2, cyan) and endoderm-specific (end-1P::mCherry-PHPLC∂, yellow) cell surface markers. Time sequence begins just after the birth of Z2 and Z3 (0 minutes), and continues through the period of PGC ingression (A-C). Broken lines mark the eggshell. (B,C) During PGC ingression. (D,E) After PGC ingression, endodermal cells begin to wrap around PGCs. (F) Quantification of dorsal movements of PGCs and endoderm during PGC ingression; error bars indicate s.d., n=6 embryos. (G,H) Wild-type embryo expressing cytoplasmic YFP in C and D lineages (pal-1P::YFP, green) and endoderm-specific mCherry (end-1P::mCherry-PHPLC∂, magenta) localized to the plasma membrane (G, eight E cells; H, 16 E cells). Double-headed arrow indicates the thickness of the dorsal C-cell layer. (I) Quantification of PGC and endoderm dorsal movements following C irradiation (n=6 wild-type embryos, n=10 C-irradiated embryos); primary data are shown in supplementary material Fig. S2. Asterisks indicate a significant difference in distance traveled (***P<0.001, two-tailed Student's t-test).
Fig. 4.
Fig. 4.
HMR-1 and PGC ingression. Embryos (~50 μm in length) in A,B,D are oriented anterior towards the left and are shown from the ventral perspective. (A,B) Forty-four-cell stage (A) and ~200-cell stage (B) embryos immunostained for HMR-1 (yellow). Nuclei, blue; PGCs, asterisks. (C) PGC ingression in wild-type embryos fed on empty vector RNAi bacteria (n=10), in hmr-1(RNAi) embryos (n=9), in hmr-1; hmr-1Ex embryos (n=29) and in hmr-1; hmr-1Ex hmr-1(RNAi) embryos (n=14). Asterisks indicate a significant difference in whether PGCs ingressed (*P<0.05, ***P<0.001) relative to wild-type controls fed on empty vector RNAi (Fisher's exact test). (D) hmr-1; hmr-1Ex embryo showing superficial PGCs (cyan) at 210 minutes. Dashed line marks the gastrulation cleft. (E,F) Wild-type (E) or hmr-1; hmr-1Ex hmr-1(RNAi) (F) embryos expressing endoderm-specific (end-1P::mCherry-PHPLC∂) and PGC-specific (mex-5P::GFP-PHPLC∂::nos-2UTR) cell surface markers during the stage when PGCs ingress; embryos are shown from the lateral perspective. A gap (arrow) between endodermal cell and PGCs can be seen in hmr-1; hmr-1Ex hmr-1(RNAi) embryos. Scale bar: 2.5 μm. (G) Frequency of spaces detected between endoderm and PGC in wild-type, hmr-1(RNAi), hmr-1; hmr-1Ex and hmr-1; hmr-1Ex hmr-1(RNAi) embryos. Number of embryos examined is indicated. (H) Extent of interface between PGCs and endoderm, represented in fraction of PGC circumference [wild type, n=10; hmr-1; hmr-1Ex hmr-1(RNAi), n=11]. Error bars indicate s.d. Asterisks indicate a significant difference in length of contact between PGCs and endoderm (**P<0.01, two-tailed Student's t-test).
Fig. 5.
Fig. 5.
HMR-1 mosaic analysis. (A) PGC ingression in wild type (1st column, n=17), in embryos with low maternal and no zygotic hmr-1 expression (2nd column, progeny of hmr-1; hmr-1Ex mothers that do not inherit hmr-1Ex, n=16), in embryos with low maternal and high zygotic hmr-1 expression (3rd column, progeny of hmr-1; hmr-1Ex mothers that inherit hmr-1Ex, n=13), and in embryos with high maternal and no zygotic hmr-1 expression (4th column, progeny of hmr-1; hmr-1Ex; mex-5P:HMR-1-GFP::hmr-1UTR mothers that do not inherit hmr-1Ex, n=18). Asterisks indicate a significant difference in whether PGCs ingressed (**P<0.01, NS, not significant; Fisher's exact test). (B) PGC ingression in wild-type embryos fed on empty vector RNAi bacteria (1st column, n=10), hmr-1; hmr-1Ex hmr-1(RNAi) embryos (2nd column, n=14) and embryos from hmr-1; hmr-1P:HMR-1-ZF1-GFP::hmr-1UTR/ + mothers that did not inherit hmr-1P:HMR-1-ZF1-GFP::hmr-1UTR (3rd column, n=12) and therefore express HMR-1 only in PGCs. Asterisks indicate a significant difference in whether PGCs ingressed (***P<0.001, Fisher's exact test).
Fig. 6.
Fig. 6.
Regulation of HMR-1 enrichment in PGCs. Embryos (~50 μm in length) are oriented anterior towards the left and are shown from the indicated perspective. (A-C) GFP expression from the indicated transgenes. PGCs, asterisks. (D-F) GFP in embryos expressing mex-5P::GFP-PHPLC∂::hmr-1UTR immediately before (D) and after (E) photobleaching, and following recovery (F). Photobleaching was terminated before completion to prevent embryo lethality. (G-I) Quantification of fluorescence recovery after photobleaching (FRAP). AU, arbitrary units; error bars indicate s.d. (mex-5P::GFP-PHPLC∂::hmr-1UTR, n=9; mex-5P::GFP-PHPLC∂::tbb-2UTR, n=7). Asterisks indicate a significant difference in expression levels between PGC and control somatic cell contacts (**P<0.01, two-tailed Student's t-test). (I) Fold difference in expression level between PGC and somatic cell contacts.
Fig. 7.
Fig. 7.
Model for PGC ingression. Schematic of embryos, dorsal upwards, anterior leftwards. Endoderm, yellow; PGCs, cyan; HMR-1, red. See Discussion for details.

References

    1. Achilleos A., Wehman A. M., Nance J. (2010). PAR-3 mediates the initial clustering and apical localization of junction and polarity proteins during C. elegans intestinal epithelial cell polarization. Development 137, 1833-1842 - PMC - PubMed
    1. Anderson D. C., Gill J. S., Cinalli R. M., Nance J. (2008). Polarization of the C. elegans embryo by RhoGAP-mediated exclusion of PAR-6 from cell contacts. Science 320, 1771-1774 - PMC - PubMed
    1. Audhya A., Hyndman F., McLeod I. X., Maddox A. S., Yates J. R., 3rd, Desai A., Oegema K. (2005). A complex containing the Sm protein CAR-1 and the RNA helicase CGH-1 is required for embryonic cytokinesis in Caenorhabditis elegans. J. Cell Biol. 171, 267-279 - PMC - PubMed
    1. Borghi N., Nelson W. J. (2009). Intercellular adhesion in morphogenesis: molecular and biochysical considerations. Curr. Top. Dev. Biol. 89, 1-32 - PubMed
    1. Broadbent I. D., Pettitt J. (2002). The C. elegans hmr-1 gene can encode a neuronal classic cadherin involved in the regulation of axon fasciculation. Curr. Biol. 12, 59-63 - PubMed

Publication types