. 2012 Jun 4:6:155.
doi: 10.3389/fnhum.2012.00155. eCollection 2012.

High frequency deep brain stimulation attenuates subthalamic and cortical rhythms in Parkinson's disease

Affiliations

High frequency deep brain stimulation attenuates subthalamic and cortical rhythms in Parkinson's disease

Diane Whitmer et al. Front Hum Neurosci. .

Abstract

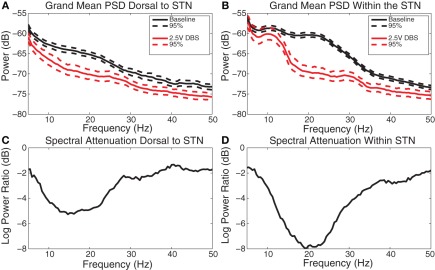
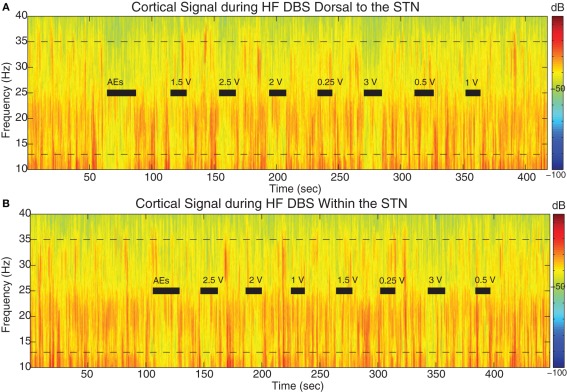
Parkinson's disease (PD) is marked by excessive synchronous activity in the beta (8-35 Hz) band throughout the cortico-basal ganglia network. The optimal location of high frequency deep brain stimulation (HF DBS) within the subthalamic nucleus (STN) region and the location of maximal beta hypersynchrony are currently matters of debate. Additionally, the effect of STN HF DBS on neural synchrony in functionally connected regions of motor cortex is unknown and is of great interest. Scalp EEG studies demonstrated that stimulation of the STN can activate motor cortex antidromically, but the spatial specificity of this effect has not been examined. The present study examined the effect of STN HF DBS on neural synchrony within the cortico-basal ganglia network in patients with PD. We measured local field potentials dorsal to and within the STN of PD patients, and additionally in the motor cortex in a subset of these patients. We used diffusion tensor imaging (DTI) to guide the placement of subdural cortical surface electrodes over the DTI-identified origin of the hyperdirect pathway (HDP) between motor cortex and the STN. The results demonstrated that local beta power was attenuated during HF DBS both dorsal to and within the STN. The degree of attenuation was monotonic with increased DBS voltages in both locations, but this voltage-dependent effect was greater in the central STN than dorsal to the STN (p < 0.05). Cortical signals over the estimated origin of the HDP also demonstrated attenuation of beta hypersynchrony during DBS dorsal to or within STN, whereas signals from non-specific regions of motor cortex were not attenuated. The spatially-specific suppression of beta synchrony in the motor cortex support the hypothesis that DBS may treat Parkinsonism by reducing excessive synchrony in the functionally connected sensorimotor network.

Keywords: Parkinson's disease; beta rhythm; deep brain stimulation (DBS); electrocorticography (ECoG); intracranial EEG; motor cortex; subthalamic nucleus; synchrony.


Figures

Figure 1
Figure 1
Experimental design. In all cases (n = 13), STN LFPs were recorded bilaterally between electrodes 0–2, before and during DBS stimulation through electrode 1, in each of the two positions. The first position places the center of electrode 1 at 1.5 mM dorsal to the dorsal border of the STN, and the second position places the center of electrode 1 within the STN. In a subset of these cases (n = 3), the 1 mM distal tip of the cannula that ensheaths the microelectrode was used to record monopolar LFPs after functional mapping and before implantation of the DBS lead, in each of two positions: (1) 1 mM dorsal to the dorsal border of the STN, and (2) at the midpoint of the dorsal and ventral borders of the STN. In these cases, the ECoG strip was placed over ipsilateral motor cortex during all STN recordings (cannula and DBS lead).
Figure 2
Figure 2
Diffusion tensor imaging used to guide ECoG strip placement. (A), (B), (C) depict a screen capture from the StealthViz neuronavigational system showing the localization of the origin of the “hyperdirect pathway” as targeted during surgery. (D) Sagittal view of a DTI image used to guide the positioning of the ECoG strip during surgery. Deterministic fiber tracking was first performed using a commercial software package (StealthViz, Medtronic Navigation, Louisville, CO). A trapezoidal region of interest was defined initially at 12 mM lateral to the midline, 4 mM below the anterior commissure–posterior commissure (AC–PC) plane, and 3 mM behind the midpoint of the AC–PC line. This ROI was adjusted to fit the STN as identified by typical signal characteristics on T2 CUBE imaging. From this starting ROI, fibers were automatically traced using a fractional anisotropy threshold of 0.2, a minimal fiber length of 30 mM, and a curvature threshold of 50°. The resulting tractographically-defined “hyperdirect pathway” was displayed in three dimensions, overlaid on the co-registered T2 and SPGR images. This surface was exported along with the T2 CUBE dataset for use during surgery (A,B,C) to localize the cortical origin of the HDP.
Figure 3
Figure 3
Spectral dynamics of LFPs dorsal to and within the STN. Spectrogram of LFPs during DBS (A) 1.5 mM dorsal to the dorsal border of the STN and (B) within the STN (2.25 mM below dorsal border) from a representative patient (case 2L). Dotted lines demark the 13–35 Hz limits. Gray bars indicate the 10 s period of HF DBS used in beta power calculations, which excluded artifacts at the onset and offset of DBS, and black bars indicate the full time period that HF DBS was on. The bars marked “AEs” demark the period of time when HF DBS was increased from 0 to 3 V to test for adverse clinical effects; these segments were not used in analyses. Note the randomized order of the presentation of HF DBS voltages. The color scale indicates the level of log beta power on a decibel scale and is the same for the spectrograms in panels (A) and (B), demonstrating that there is greater beta power during the off stimulation time segments and greater attenuation within the STN during HF DBS within the STN (B). Note the return of beta power in between periods of HF DBS.
Figure 4
Figure 4
DBS-induced beta attenuation dorsal to and in central STN. Box and whisker plots [median, 25%, 75%, range, and outliers (red dots)] of relative beta attenuation during HF DBS (A) dorsal to and (B) within STN. A ratio was taken between 13 and 35 Hz beta power and 5 and 100 Hz broadband power during stimulation epochs, and then normalized to the baseline beta ratio. The 10log10 power ratio was computed, such that all cases can be compared on a decibel scale. *Indicate a significant difference from baseline with overall p < 0.05 (ANOVA with Holm–Sidak correction). The 50% attenuation level is marked with a dashed line, represented at −3 dB.
Figure 5
Figure 5
DBS-induced spectral attenuation. (A) Group mean power spectral density before (black) and during (red) 2.5 V DBS applied dorsal to the STN with 95% confidence limits. (B) Group mean power spectral density before (black) and during (red) 2.5 V DBS applied within the STN with 95% confidence limits. (C) Log power ratio (dB) of spectral power during 2.5 V DBS dorsal to the STN to spectral power at baseline. (D) Log power ratio (dB) of spectral power during 2.5 V DBS within the STN to spectral power at baseline.
Figure 6
Figure 6
STN DBS-induced beta attenuation in motor cortex. Spectrogram of single cortical ECoG channel during STN DBS (A) 1.5 mM dorsal to the dorsal border of the STN and (B) within the STN (2.6 mM below dorsal border) from a representative patient (case 6). Black bars indicate the full time period that HF DBS was on. The bars marked “AEs” demark the period of time when HF DBS was increased from 0 to 3 V to test for adverse clinical effects; these segments were not used in analyses. Note the randomized order of the presentation of HF DBS voltages. The color scale indicates the level of log beta power on a decibel scale and is the same for the spectrograms in panels (A) and (B), but is different from the scale in Figure 3. Note the power rebound when STN DBS is turned off.
Figure 7
Figure 7
DBS-induced spectral attenuation in ipsilateral motor cortex. Magnitude of coherence between each cortical bipolar pair and the STN cannula (A) 1 mM dorsal to STN, (C) central STN of a representative patient (case 6R). Spectrograms of motor cortex ECoG during HF DBS (B) 1.5 mM dorsal to the STN, and (D) within the central STN. Black bars in (B) and (D) indicate time periods when DBS was on. Rows represent bipolar pairs from the ECoG 1 × 6 electrode strip. For this case (6R), ECoG electrode #3 was estimated to be closest to the purported efferent projection site of the hyperdirect pathway.
Figure 8
Figure 8
Spatial specificity of spectral attenuation. (A) Schematic of electrode array. Power spectral densities with 95% confidence limits before (black) and during (red) 2.5 V DBS within the STN for each ECoG bipolar pair for (B) case 4R, (C) case 6R, and (D) case 8R. Cortical electrode #3 was placed over the efferent projection site of the hyperdirect pathway for both case 4R and case 6R. For case 8R, the patient's ECoG strip ended up ~11 mM lateral to the target, in a non-specific area of motor cortex. Four out of five bipolar pairs for this patient demonstrated no spectral modulation during STN HF DBS. The spectrograms for this case are shown in Figures A2.
Figure A1
Figure A1
Spectral attenuation in ipsilateral motor cortex of single case (4R). Magnitude of coherence between each cortical bipolar pair and the STN cannula (A) 1 mM dorsal to STN, (C) central STN of another patient (case 4R). Spectrograms of motor cortex ECoG during HF DBS (B) 1.5 mM dorsal to the STN, and (D) within the central STN. Rows represent bipolar pairs from the ECoG 1 × 6 electrode strip. ECoG electrode #3 was estimated to be closest to the purported efferent projection site of the hyperdirect pathway. Coherence computation missing in cases where cortical channel #4 was contaminated by noise.
Figure A2
Figure A2
Spectrogram of the motor cortex ECoG during HF DBS (A) 1 mM dorsal to the STN, and (C) within the central STN of patient case 8R. This patient's ECoG strip was placed ~1 cm lateral to the intended target. (B) Magnitude of coherence between each cortical bipolar pair and the STN cannula in the central STN. Data for coherence computations between the dorsal STN region and cortex were not available from this patient. Rows in (A), (B), (C) represent bipolar pairs from the ECoG 1 × 6 electrode strip.

References

    1. Albin R. L., Young A. B., Penney J. B. (1989). The functional anatomy of basal ganglia disorders. Trends Neurosci. 12, 366–375 - PubMed
    1. Alexander G. E., DeLong M. R., Strick P. L. (1986). Parallel organization of functionally segregated circuits linking basal ganglia and cortex. Annu. Rev. Neurosci. 9, 357–381 10.1146/annurev.ne.09.030186.002041 - DOI - PubMed
    1. Ashby P., Paradiso G., Saint-Cyr J. A., Chen R., Lang A. E., Lozano A. M. (2001). Potentials recorded at the scalp by stimulation near the human subthalamic nucleus. Clin. Neurophysiol. 112, 431–437 - PubMed
    1. Baker K. B., Montgomery E. B. Jr., Rezai A. R., Burgess R., Luders H. O. (2002). Subthalamic nucleus deep brain stimulus evoked potentials: physiological and therapeutic implications. Mov. Disord. 17, 969–983 10.1002/mds.10206 - DOI - PubMed
    1. Bergman H., Feingold A., Nini A., Raz A., Slovin H., Abeles M., Vaadia E. (1998). Physiological aspects of information processing in the basal ganglia of normal and parkinsonian primates. Trends Neurosci. 21, 32–38 10.1016/S0166-2236(97)01151-X - DOI - PubMed