Meta-Analysis
. 2012;7(5):e38028.
doi: 10.1371/journal.pone.0038028. Epub 2012 May 31.

A meta-analysis of the existing knowledge of immunoreactivity against hepatitis C virus (HCV)

Affiliations
Meta-Analysis

A meta-analysis of the existing knowledge of immunoreactivity against hepatitis C virus (HCV)

Yohan Kim et al. PLoS One. 2012.

Abstract

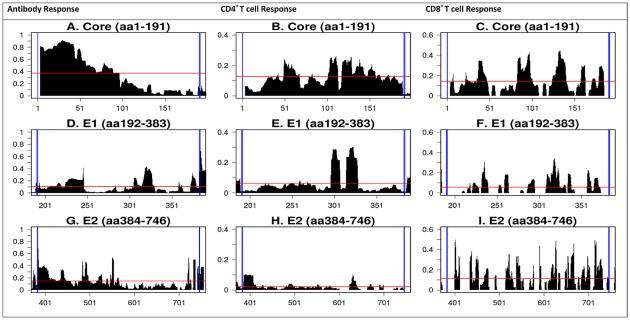
Approximately 3% of the world population is infected by HCV, which represents a major global health challenge. Almost 400 different scientific reports present immunological data related to T cell and antibody epitopes derived from HCV literature. Analysis of all HCV-related epitope hosted in the Immune Epitope Database (IEDB), a repository of freely accessible immune epitope data, revealed more than 1500 and 1900 distinct T cell and antibody epitopes, respectively. The inventory of all data revealed specific trends in terms of the host and the HCV genotypes from which sequences were derived. Upon further analysis we found that this large number of epitopes reflects overlapping structures, and homologous sequences derived from different HCV isolates. To access and visualize this information we developed a novel strategy that assembles large sets of epitope data, maps them onto reference genomes and displays the frequency of positive responses. Compilation of the HCV immune reactivity from hundreds of different studies, revealed a complex and thorough picture of HCV immune epitope data to date. The results pinpoint areas of more intense reactivity or research activities at the level of antibody, CD4 and CD8 responses for each of the individual HCV proteins. In general, the areas targeted by the different effector immune functions were distinct and antibody reactivity was positively correlated with hydrophilicity, while T cell reactivity correlated with hydrophobicity. At the sequence level, epitopes frequently recognized by both T cell and B cell correlated with low variability, and our analysis thus highlighted areas of potential interest for practical applications. The human reactivity was further analyzed to pinpoint differential patterns of reactivity associated with acute versus chronic infection, to reveal the apparent impact of glycosylation on T cell, but not antibody responses, and to highlight a paucity of studies involved antibody epitopes associated with virus neutralization.


Conflict of interest statement

Competing Interests: The authors have declared that no competing interests exist.

Figures

Figure 1
Figure 1. Epitope distribution among host species.
Data represent the number of epitopes identified (in parentheses) for each host species reported to date.
Figure 2
Figure 2. Response frequency score data for NS3 (1248–1261) mapped onto reference genome.
Data represent epitope immunoreactivity for a region on the NS3 protein (aa1230–1275) containing the immunodominant epitope has been mapped onto the reference genome HCV strain H77. A larger region was chosen in order to allow for visualization of reactivity upstream and downstream of the known epitope. RFscores (frequency values in the 0–1 range) are shown on the Y-axis and the location on the HCV polyprotein in amino acid is presented on the X-axis. User inputs include the ‘start’ and ‘end’ position of the region of interest, the minimum and maximum axis value and the RFscore cutoff point to adjust stringency of data returned.
Figure 3
Figure 3. Detailed reactivity maps for HCV structural proteins.
Data represent individual RFscores for antibody, CD4+ and CD8+ T cell responses plotted for each antigen translated from the HCV H77 reference polyprotein: A–C = core; D–F = E1; G–I = E2. The red line denotes average frequency for all antibody, CD4 and CD8 T cell responses. Note: Data displayed for antibody reactivity only include linear epitopes. Note: decimal values for RF scores on the Y-axis are converted to percent in the text.
Figure 4
Figure 4. Detailed reactivity maps for HCV non-structural proteins.
Data represent individual RFscores for antibody, CD4+ and CD8+ T cell responses plotted for each antigen translated from the HCV H77 reference polyprotein: A–C = NS2; D–F = NS3; G–I = NS4a; J–L = NS4b; M–O = NS5a; P–R = NS5b. The red line denotes average frequency for all antibody, CD4 and CD8 T cell responses. Note: decimal values for RF scores on the Y-axis are converted to percent in the text.
Figure 5
Figure 5. Analysis of immune responsiveness versus physical properties of HCV polyprotein.
A) Antibody response (RF) scores plotted along the length of the HCV H77 polyprotein, B) T cell response frequency (RF) scores plotted along the length of the HCV H77 polyprotein, C) Hydrophilicty data calculated for the HCV H77 polyprotein using the Parker method, and D) Entropy scores calculated for all HCV sequence data available from the Los Alamos Lab HCV database and plotted along the entire ployprotein. Black arrows indicate regions of high imunoreactivity and low entropy.
Figure 6
Figure 6. Human response frequency scores in acute versus chronic HCV infection.
Data represent RFscores plotted along the length of the HCV H77 reference polyprotein for epitope defined in human disease. A) T cells responses for acute infection; B) T cells responses for chronic infection; C) Antibody responses for acute infection; D) Antibody responses for chronic infection. The red line denotes average frequency for all responses.

References

    1. WHO website. 15 Available: http//: www.who.int/mediacentre/factsheets/fs164/en/. Accessed 2012 February.
    1. Vaughan K, Greenbaum J, Blythe M, Peters B, Sette A. Meta-analysis of all immune epitope data in the Flavivirus genus: inventory of current immune epitope data status in the context of virus immunity and immunopathology. Viral Immunol. 2010;23:259–84. - PMC - PubMed
    1. Vaughan K, Blythe M, Greenbaum J, Zhang Q, Peters B, et al. Meta-analysis of immune epitope data for all Plasmodia: overview and applications for malarial immunobiology and vaccine-related issues. Parasite Immunol. 2009;31:78–97. - PMC - PubMed
    1. Zarebski LM, Vaughan K, Sidney J, Peters B, Grey H, et al. Analysis of epitope information related to Bacillus anthracis and Clostridium botulinum. Expert Rev Vaccines. 2008;7:55–74. - PMC - PubMed
    1. Blythe MJ, Zhang Q, Vaughan K, de Castro R, Salimi N, et al. An analysis of the epitope knowledge related to Mycobacteria. Immunome Res. 2007;3:10. - PMC - PubMed

Publication types