In vivo human apolipoprotein E isoform fractional turnover rates in the CNS
- PMID: 22675504
- PMCID: PMC3366983
- DOI: 10.1371/journal.pone.0038013
In vivo human apolipoprotein E isoform fractional turnover rates in the CNS
Abstract
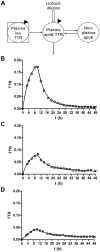
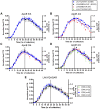
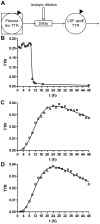
Apolipoprotein E (ApoE) is the strongest genetic risk factor for Alzheimer's disease and has been implicated in the risk for other neurological disorders. The three common ApoE isoforms (ApoE2, E3, and E4) each differ by a single amino acid, with ApoE4 increasing and ApoE2 decreasing the risk of Alzheimer's disease (AD). Both the isoform and amount of ApoE in the brain modulate AD pathology by altering the extent of amyloid beta (Aβ) peptide deposition. Therefore, quantifying ApoE isoform production and clearance rates may advance our understanding of the role of ApoE in health and disease. To measure the kinetics of ApoE in the central nervous system (CNS), we applied in vivo stable isotope labeling to quantify the fractional turnover rates of ApoE isoforms in 18 cognitively-normal adults and in ApoE3 and ApoE4 targeted-replacement mice. No isoform-specific differences in CNS ApoE3 and ApoE4 turnover rates were observed when measured in human CSF or mouse brain. However, CNS and peripheral ApoE isoform turnover rates differed substantially, which is consistent with previous reports and suggests that the pathways responsible for ApoE metabolism are different in the CNS and the periphery. We also demonstrate a slower turnover rate for CSF ApoE than that for amyloid beta, another molecule critically important in AD pathogenesis.
Conflict of interest statement
Figures


Similar articles
-
Interaction of nascent ApoE2, ApoE3, and ApoE4 isoforms expressed in mammalian cells with amyloid peptide beta (1-40). Relevance to Alzheimer's disease.Biochemistry. 1997 Aug 26;36(34):10571-80. doi: 10.1021/bi9626362. Biochemistry. 1997. PMID: 9265639
-
Apolipoprotein E and oxidative stress in brain with relevance to Alzheimer's disease.Neurobiol Dis. 2020 May;138:104795. doi: 10.1016/j.nbd.2020.104795. Epub 2020 Feb 6. Neurobiol Dis. 2020. PMID: 32036033 Free PMC article. Review.
-
Plasma ApoE4 Levels Are Lower than ApoE2 and ApoE3 Levels, and Not Associated with Plasma Aβ40/42 Ratio as a Biomarker of Amyloid-β Amyloidosis in Alzheimer's Disease.J Alzheimers Dis. 2023;93(1):333-348. doi: 10.3233/JAD-220996. J Alzheimers Dis. 2023. PMID: 36970894
-
Human ApoE Isoforms Differentially Modulate Glucose and Amyloid Metabolic Pathways in Female Brain: Evidence of the Mechanism of Neuroprotection by ApoE2 and Implications for Alzheimer's Disease Prevention and Early Intervention.J Alzheimers Dis. 2015;48(2):411-24. doi: 10.3233/JAD-150348. J Alzheimers Dis. 2015. PMID: 26402005 Free PMC article.
-
The interaction of amyloid-beta with ApoE.Subcell Biochem. 2005;38:255-72. doi: 10.1007/0-387-23226-5_13. Subcell Biochem. 2005. PMID: 15709483 Review.
Cited by
-
Plasma Apolipoprotein E3 and Glucose Levels Are Associated in APOE ɛ3/ɛ4 Carriers.J Alzheimers Dis. 2021;81(1):339-354. doi: 10.3233/JAD-210065. J Alzheimers Dis. 2021. PMID: 33814450 Free PMC article.
-
No diurnal variation of classical and candidate biomarkers of Alzheimer's disease in CSF.Mol Neurodegener. 2016 Sep 7;11(1):65. doi: 10.1186/s13024-016-0130-3. Mol Neurodegener. 2016. PMID: 27605218 Free PMC article.
-
Kinetics of plasma apolipoprotein E isoforms by LC-MS/MS: a pilot study.J Lipid Res. 2018 May;59(5):892-900. doi: 10.1194/jlr.P083576. Epub 2018 Mar 14. J Lipid Res. 2018. PMID: 29540575 Free PMC article.
-
Circulating apoE4 protein levels from dried blood spots predict cognitive function in a large population-based survey setting.Alzheimers Dement. 2024 Nov;20(11):7613-7623. doi: 10.1002/alz.14224. Epub 2024 Sep 5. Alzheimers Dement. 2024. PMID: 39234633 Free PMC article.
-
Multi-peptide characterization of plasma neurofilament light chain in preclinical and mild Alzheimer's disease.Brain Commun. 2024 Aug 20;6(4):fcae247. doi: 10.1093/braincomms/fcae247. eCollection 2024. Brain Commun. 2024. PMID: 39165480 Free PMC article.
References
-
- Mahley RW, Rall SC. Apolipoprotein E: far more than a lipid transport protein. Annu Rev Genomics Hum Genet. 2000;1:507–537. - PubMed
-
- Hatters DM, Peters-Libeu CA, Weisgraber KH. Apolipoprotein E structure: insights into function. Trends Biochem Sci. 2006;31:445–454. - PubMed
-
- Weisgraber KH. Apolipoprotein E distribution among human plasma lipoproteins: role of the cysteine-arginine interchange at residue 112. J Lipid Res. 1990;31:1503–1511. - PubMed
Publication types
MeSH terms
Substances
Grants and funding
- DK056341/DK/NIDDK NIH HHS/United States
- A2008-345/PHS HHS/United States
- P30-RR000954/RR/NCRR NIH HHS/United States
- R01 AG013956/AG/NIA NIH HHS/United States
- P50 AG005681/AG/NIA NIH HHS/United States
- P30 DK056341/DK/NIDDK NIH HHS/United States
- UL1 RR024992/RR/NCRR NIH HHS/United States
- AG13956/AG/NIA NIH HHS/United States
- R37 AG013956/AG/NIA NIH HHS/United States
- K23 AG030946/AG/NIA NIH HHS/United States
- P50-AG05681/AG/NIA NIH HHS/United States
- P60 DK020579/DK/NIDDK NIH HHS/United States
- P30 DK020579/DK/NIDDK NIH HHS/United States
- P30NS069329/NS/NINDS NIH HHS/United States
- DK020579/DK/NIDDK NIH HHS/United States
- KL2 RR 024994/RR/NCRR NIH HHS/United States
- R01 NS065667/NS/NINDS NIH HHS/United States
- TL1 RR024995/RR/NCRR NIH HHS/United States
- NIA K23 AG030946/AG/NIA NIH HHS/United States
- UL1 TR000448/TR/NCATS NIH HHS/United States
- KL2 RR024994/RR/NCRR NIH HHS/United States
- NINDS RO1-NS065667/NS/NINDS NIH HHS/United States
- P41 RR000954/RR/NCRR NIH HHS/United States
- P30 NS069329/NS/NINDS NIH HHS/United States
LinkOut - more resources
Full Text Sources
Molecular Biology Databases
Miscellaneous

