. 2012:2012:946586.
doi: 10.1155/2012/946586. Epub 2012 May 17.

Extension of Chronological Lifespan by Hexokinase Mutation in Kluyveromyces lactis Involves Increased Level of the Mitochondrial Chaperonin Hsp60

Affiliations

Extension of Chronological Lifespan by Hexokinase Mutation in Kluyveromyces lactis Involves Increased Level of the Mitochondrial Chaperonin Hsp60

Lisa Rizzetto et al. J Aging Res. 2012.

Abstract

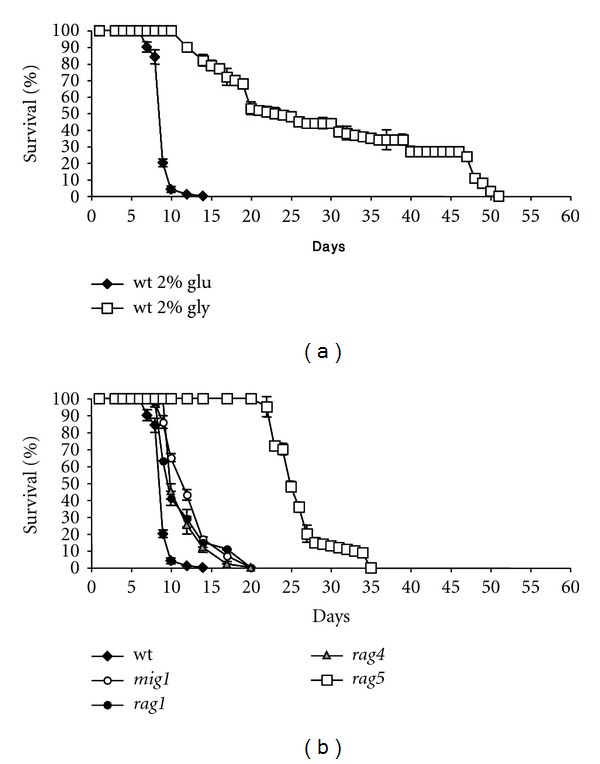
Oxidative damage, mitochondrial dysfunction, genomic instability, and telomere shortening represent all molecular processes proposed as causal factors in aging. Lifespan can be increased by metabolism through an influence on such processes. Glucose reduction extends chronological lifespan (CLS) of Saccharomyces cerevisiae through metabolic adaptation to respiration. To answer the question if the reduced CLS could be ascribed to glucose per se or to glucose repression of respiratory enzymes, we used the Kluyveromyces lactis yeast, where glucose repression does not affect the respiratory function. We identified the unique hexokinase, encoded by RAG5 gene, as an important player in influencing yeast lifespan by modulating mitochondrial functionality and the level of the mitochondrial chaperonin Hsp60. In this context, this hexokinase might have a regulatory role in the influence of CLS, shedding new light on the complex regulation played by hexokinases.


Figures

Figure 1
Figure 1
Chronological lifespan of yeast K. lactis. (a) Comparison of chronological survival of wild type JA6 grown in either glucose 2% and glycerol 2%. (b) Comparison of chronological survival in YPD medium of wild type strain and several mutants in glucose repression pathway. For each analysis (a, b) aliquots of cultures were counting over time and serial dilutions were plated on solid medium. Colony forming units were counted after 3 days. Data are representative of at least three independent experiments, mean ± s.d.
Figure 2
Figure 2
Evaluation of gene dosage of RAG5 in determining the lifespan. Comparison of chronological survival in YNB medium of wt and mutant lacking RAG5 and the same strain overexpressing RAG5. Survival was assessed in minimal medium for plasmid maintenance. Over time, aliquots of cultures were counted and serial dilutions were plated on solid medium. Colony forming units were counted after 3 days. Data are representative of five independent experiments, mean ± s.d.
Figure 3
Figure 3
Oxidative stress analysis in rag5Δ strain. (a) Evaluation of stress resistance of the long-lived strain by inducing ROS damage with 5 and 20 μM menadione. (b) Evaluation of ROS accumulation in 1 day cultures of wt and rag5 cells challenged with 20 μM menadione for 2 hours. The results were the mean of at least three independent experiments with s.d. <5%. (c, d) Measurement of cellular ROS. FACS analysis of aging cells stained for cellular ROS using DHR123 (c) and cellular superoxide using DHE (d) are shown. The mean fluorescent intensity of three independent experiments is plotted ± one standard deviation.**P value from a Student's t-test, <0.01, ***P value from a student's t-test, <0.001. (e) Total glutathione levels. GSH levels were normalized with respect to the protein total content of the samples. The results are the mean of three independent experiments with s.d. <5%. (f) Northern analysis of CTA1, CTT1, SOD1, and SOD2 in wt strain and in rag5Δ strain. Total mRNAs were prepared as described in Section 2 from cells grown on YPD medium for 24 and 48 hours. Lines 1: wt, 24 h; line 2: rag5Δ, 24 h; lines 3: wt, 48 h; line 4: rag5Δ, 48 h. The experiment showed is representative of three independent experiments, repeated with similar results.
Figure 4
Figure 4
Functional analysis of mitochondria in the long-lived mutant. (a) Comparison of mitochondrial morphology of rag5Δ and wt strains after growth in YPD medium. Analysis was performed by taking aliquots at the indicated times and observing cells after DASPMI staining at the fluorescence microscopy. (b) Mitochondrial membrane potential determined by DiOC6 staining and FACS analysis. Values are expressed as mean fluorescent intensity. Means of four biological replicates ± one standard deviation are graphed. **P value from a Student's t-test, <0.01, ***P value from a Student's t-test, <0.001. (c) Cytochrome spectra. Cell samples were collected at day 1 and cytochrome spectra were evaluated. The peaks at 550, 560, and 602 nm (vertical bars) correspond to cytochromes c, b, and aa3, respectively. The height of each peak relative to the baseline of each spectrum is an index of cytochrome content. Data are representative of three independent experiments, repeated with similar results. (d) Oxygen consumption rates in wt and rag5Δ cells. Cell samples were collected at days 1, 2, and 4 and oxygen consumption was measured at 30°C using a Clark type oxygen electrode. Data are means ± s.d. of three independent experiments. Data were normalized for the number of live cells.
Figure 5
Figure 5
Analysis of involvement of Hsp60 in chronological aging and mitochondrial functionality. (a) Analysis by SDS-PAGE, western blotting of Hsp60 protein and northern analysis of HSP60 in the wt and in the isogenic rag5Δ strain. Determination of protein level by western analysis was performed as described in Section 2. Total mRNAs were prepared as described in Section 2 from cells grown on YPD medium for 24, 48 hr, 10 days. RNA was hybridized with labelled probes for HSP60 and 26S. Data are representative of three independent experiments, repeated with similar results. (b) Evaluation of gene dosage of HSP60 in determining the lifespan. Comparison of chronological survival in YPD medium of wt, rag5Δ strain, and the same strains overexpressing HSP60 gene. Survival was assessed in minimal medium for plasmid maintenance. Over time, aliquots of cultures were counted and serial dilutions were plated on solid medium. Colony forming units were counted after 3 days. Data are representative of three independent experiments, mean ± s.d. (c) DASPMI staining in wt cells overexpressing HSP60 gene after growth in YPD medium. Analysis was performed by taking aliquots at the indicated times and observing cells after DASPMI staining at the fluorescence microscopy. (d) Evaluation of mitochondrial nucleoids morphology along CLS in rag5Δ, wt and wt/HSP60 strains. Samples were collected at the indicated time-points and fluorescence was observed after DAPI in vivo staining.

Similar articles

Cited by

References

    1. Fabrizio P, Longo VD. The chronological life span of Saccharomyces cerevisiae . Methods in Molecular Biology. 2007;371:89–95. - PubMed
    1. Parrella E, Longo VD. The chronological life span of Saccharomyces cerevisiae to study mitochondrial dysfunction and disease. Methods. 2008;46(4):256–262. - PubMed
    1. Jiang JC, Jaruga E, Repnevskaya MV, Jazwinski SM. An intervention resembling caloric restriction prolongs life span and retards aging in yeast. The FASEB Journal. 2000;14(14):2135–2137. - PubMed
    1. Lin SJ, Defossez PA, Guarente L. Requirement of NAD and SIR2 for life-span extension by calorie restriction in Saccharomyces cerevisiae . Science. 2000;289(5487):2126–2128. - PubMed
    1. Masoro EJ. Overview of caloric restriction and ageing. Mechanisms of Ageing and Development. 2005;126(9):913–922. - PubMed