

Single blood-Hg samples can result in exposure misclassification: temporal monitoring within the Japanese community (United States)
- PMID: 22676231
- PMCID: PMC3410813
- DOI: 10.1186/1476-069X-11-37
Single blood-Hg samples can result in exposure misclassification: temporal monitoring within the Japanese community (United States)
Abstract
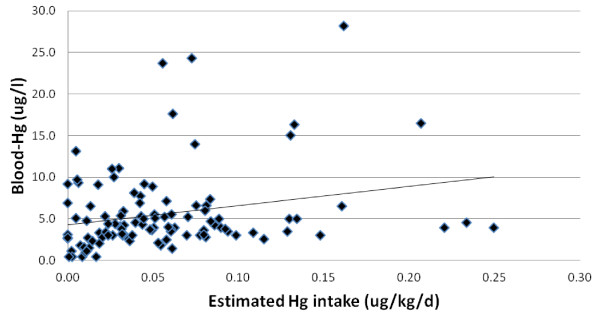
Background: The most prominent non-occupational source of exposure to methylmercury is the consumption of fish. In this study we examine a fish consuming population to determine the extent of temporal exposure and investigate the extent to which single time estimates of methylmercury exposure based on blood-Hg concentration can provide reliable estimates of longer-term average exposure.
Methods: Blood-mercury levels were obtained from a portion of the Arsenic Mercury Intake Biometric Study (AMIBS) cohort. Specifically, 56 Japanese women residing in the Puget Sound area of Washington State, US were sampled on three occasions across a one-year period.
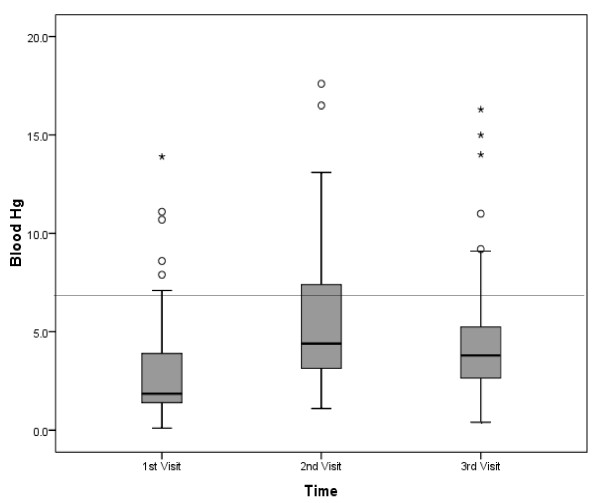
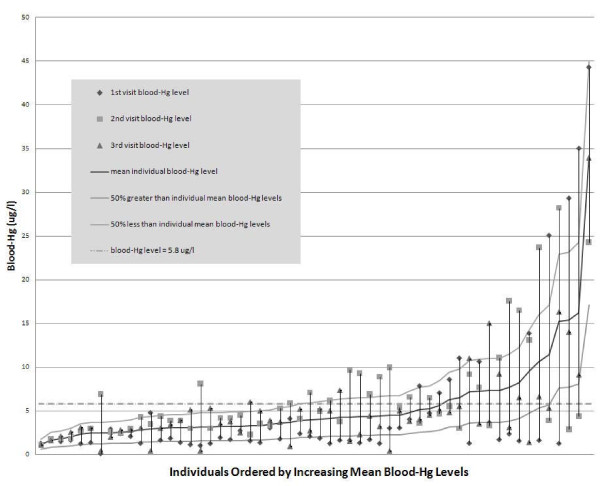
Results: An average of 135 days separated samples, with mean blood-mercury levels for the visits being 5.1, 6.6 and 5.0 μg/l and geometric means being 2.7, 4.5 and 3.1 μg/l. The blood-mercury levels in this group exceed national averages with geometric means for two of the visits being between the 90th and 95th percentiles of nationally observed levels and the lowest geometric mean being between the 75th and 90th percentile. Group means were not significantly different across sampling periods suggesting that exposure of combined subjects remained relatively constant. Comparing intra-individual results over time did not reveal a strong correlation among visits (r = 0.19, 0.50, 0.63 between 1st and 2nd, 2nd and 3rd, and 1st and 3rd sample results, respectively). In comparing blood-mercury levels across two sampling interval combinations (1st and 2nd, 2nd and 3rd, and 1st and 3rd visits, respectively), 58% (n = 34), 53% (n = 31) and 29% (n = 17) of the individuals had at least a 100% difference in blood-Hg levels.
Conclusions: Point estimates of blood-mercury, when compared with three sample averages, may not reflect temporal variability and individual exposures estimated on the basis of single blood samples should be treated with caution as indicators of long-term exposure. Reliance on single blood samples can make predicting ongoing methylmercury exposure highly speculative due to the large intra-individual variability.
Figures
Similar articles
-
Chronologically matched toenail-Hg to hair-Hg ratio: temporal analysis within the Japanese community (U.S.).Environ Health. 2012 Oct 31;11:81. doi: 10.1186/1476-069X-11-81. Environ Health. 2012. PMID: 23113987 Free PMC article.
-
Longitudinal mercury monitoring within the Japanese and Korean communities (United States): implications for exposure determination and public health protection.Environ Health Perspect. 2009 Nov;117(11):1760-6. doi: 10.1289/ehp.0900801. Epub 2009 Jul 31. Environ Health Perspect. 2009. PMID: 20049129 Free PMC article.
-
Mercury exposure from fish consumption within the Japanese and Korean communities.J Toxicol Environ Health A. 2008;71(15):1019-31. doi: 10.1080/01932690801934612. J Toxicol Environ Health A. 2008. PMID: 18569611
-
Hair mercury levels in relation to fish consumption in a community of the Moroccan Mediterranean coast.Food Addit Contam. 2007 Nov;24(11):1236-46. doi: 10.1080/02652030701329611. Food Addit Contam. 2007. PMID: 17852400 Review.
-
Determination of a site-specific reference dose for methylmercury for fish-eating populations.Toxicol Ind Health. 2000 Nov;16(9-10):335-438. doi: 10.1177/074823370001600901. Toxicol Ind Health. 2000. PMID: 11762928 Review.
Cited by
-
Chronologically matched toenail-Hg to hair-Hg ratio: temporal analysis within the Japanese community (U.S.).Environ Health. 2012 Oct 31;11:81. doi: 10.1186/1476-069X-11-81. Environ Health. 2012. PMID: 23113987 Free PMC article.
-
Prenatal mercury exposure, autism, and developmental delay, using pharmacokinetic combination of newborn blood concentrations and questionnaire data: a case control study.Environ Health. 2015 Jul 22;14:62. doi: 10.1186/s12940-015-0045-4. Environ Health. 2015. PMID: 26198445 Free PMC article.
-
Demographic Profiles, Mercury, Selenium, and Omega-3 Fatty Acids in Avid Seafood Consumers on Long Island, NY.J Community Health. 2016 Feb;41(1):165-73. doi: 10.1007/s10900-015-0082-5. J Community Health. 2016. PMID: 26318872
-
Combined exposure to three heavy metals and the risk of age-related macular degeneration in the Korean population.Sci Rep. 2025 Jul 25;15(1):27016. doi: 10.1038/s41598-025-12671-7. Sci Rep. 2025. PMID: 40707687 Free PMC article.
-
Impact of Exposure Uncertainty on the Association between Perfluorooctanoate and Preeclampsia in the C8 Health Project Population.Environ Health Perspect. 2016 Jan;124(1):126-32. doi: 10.1289/ehp.1409044. Epub 2015 Jun 19. Environ Health Perspect. 2016. PMID: 26090912 Free PMC article.
References
-
- National Research Council (U.S.) Committee on the Toxicological Effects of Methylmercury. Toxicological Effects of Methylmercury. National Acadamy Press, Washington,DC; 2000.
-
- Phelps RW, Clarkson TW, Kershaw TG, Wheatley B. Interrelationships of blood and hiar mercury concentrations in a North American population exposed to methylmercury. Arch Environ Health. 1980;35:161–168. - PubMed
-
- Morrissette J, Takser L, St-Amour G, Smargiassi A, Lafond J, Megler D. Temporal variation of blood and hair mercury levels in pregnancy in relation to fish consumption history in a population living along the St. Lawrence River. Environ Res. 2004;95:363–374. doi: 10.1016/j.envres.2003.12.007. - DOI - PubMed
Publication types
MeSH terms
Substances
Grants and funding
LinkOut - more resources
Full Text Sources
Medical
