. 2012 Jun 7;14(3):R134.
doi: 10.1186/ar3867.

Establishment and characterization of a sustained delayed-type hypersensitivity model with arthritic manifestations in C57BL/6J mice

Affiliations

Establishment and characterization of a sustained delayed-type hypersensitivity model with arthritic manifestations in C57BL/6J mice

Sara M Atkinson et al. Arthritis Res Ther. .

Abstract

Introduction: Rheumatoid arthritis (RA) is a chronic progressive, inflammatory and destructive autoimmune disease, characterised by synovial joint inflammation and bone erosion. To better understand the pathophysiology and underlying immune mechanisms of RA various models of arthritis have been developed in different inbred strains of mice. Establishment of arthritis models with components of adaptive immunity in the C57BL/6J strain of mice has been difficult, and since most genetically modified mice are commonly bred on this background, there is a need to explore new ways of obtaining robust models of arthritis in this strain. This study was undertaken to establish and characterise a novel murine model of arthritis, the delayed-type hypersensitivity (DTH)-arthritis model, and evaluate whether disease can be treated with compounds currently used in the treatment of RA.

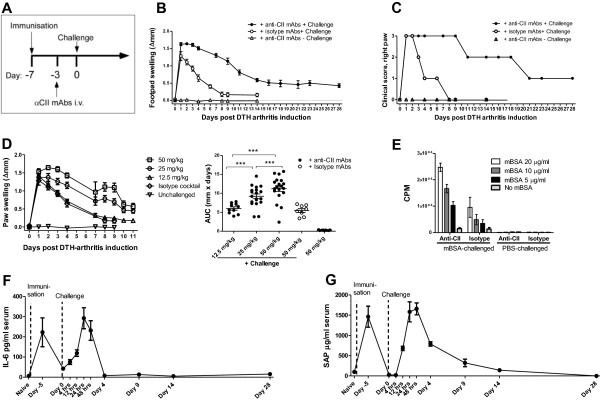
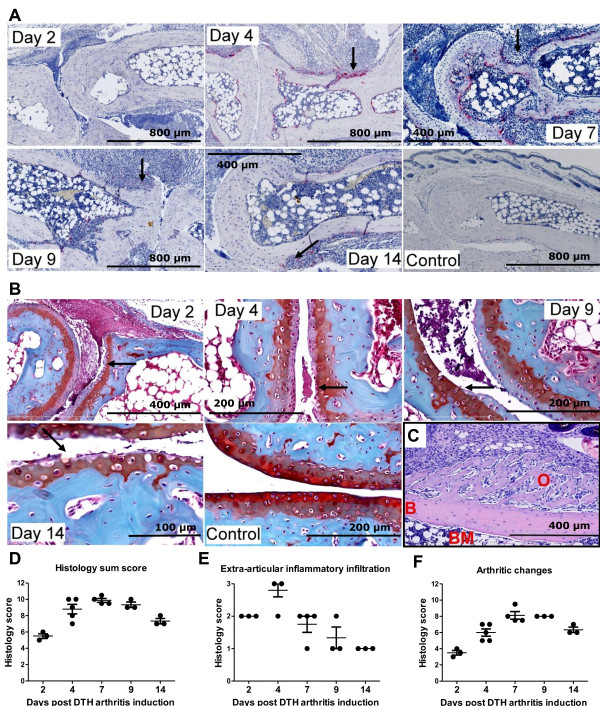
Methods: DTH-arthritis was induced by eliciting a classical DTH reaction in one paw with methylated bovine serum albumin (mBSA), with the modification that a cocktail of type II collagen monoclonal antibodies was administered between the immunisation and challenge steps. Involved cell subsets and inflammatory mediators were analysed, and tissue sections evaluated histopathologically. Disease was treated prophylactically and therapeutically with compounds used in the treatment of RA.

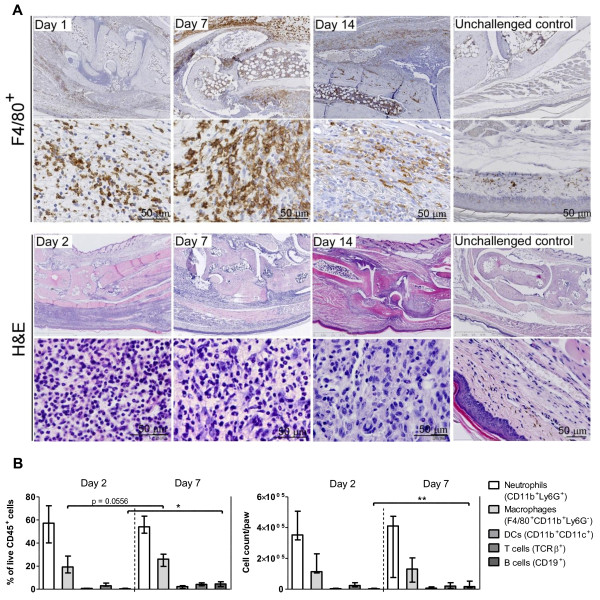
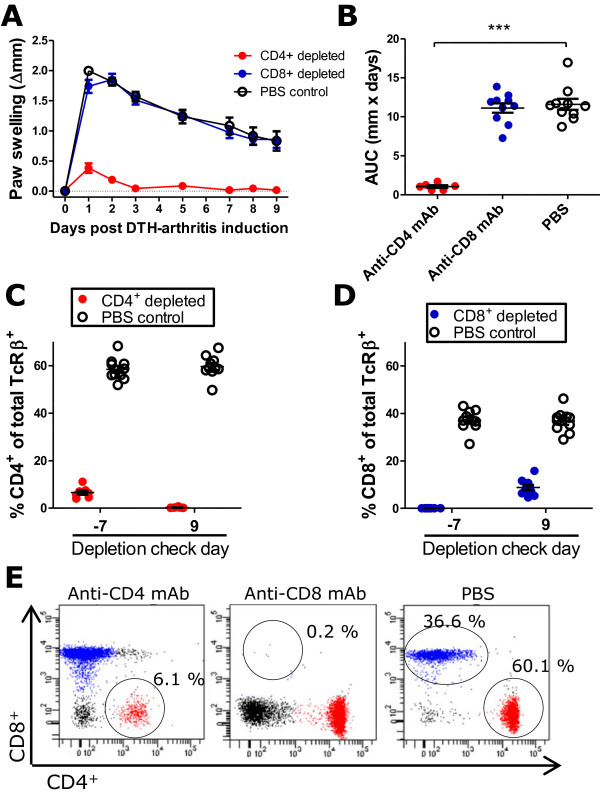
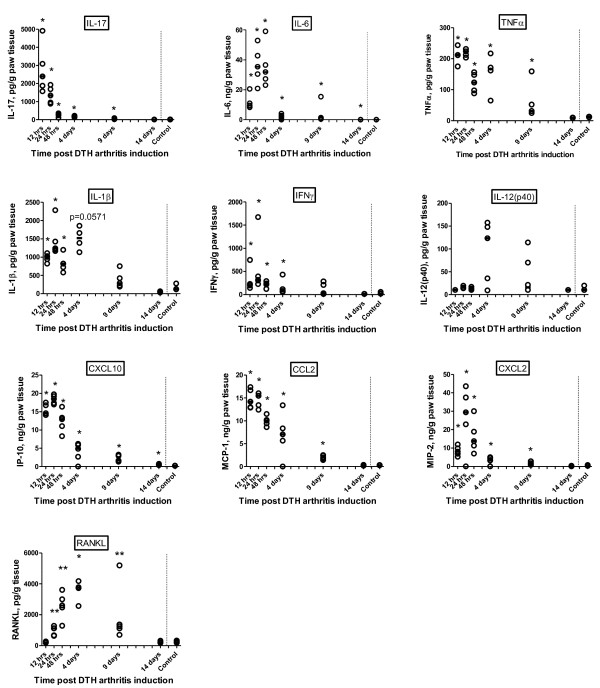
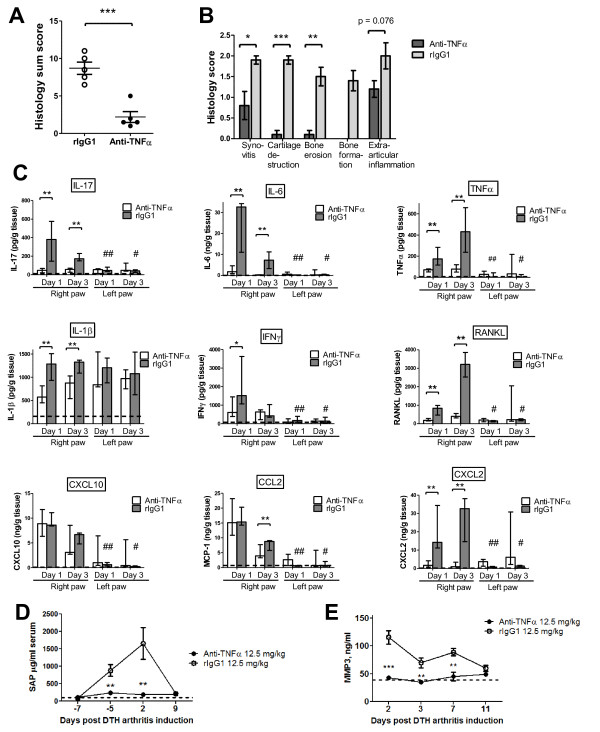
Results: We demonstrate that DTH-arthritis could be induced in C57BL/6 mice with paw swelling lasting for at least 28 days and that disease induction was dependent on CD4+ cells. We show that macrophages and neutrophils were heavily involved in the observed pathology and that a clear profile of inflammatory mediators associated with these cell subsets was induced locally. In addition, inflammatory markers were observed systemically. Furthermore, we demonstrate that disease could be both prevented and treated.

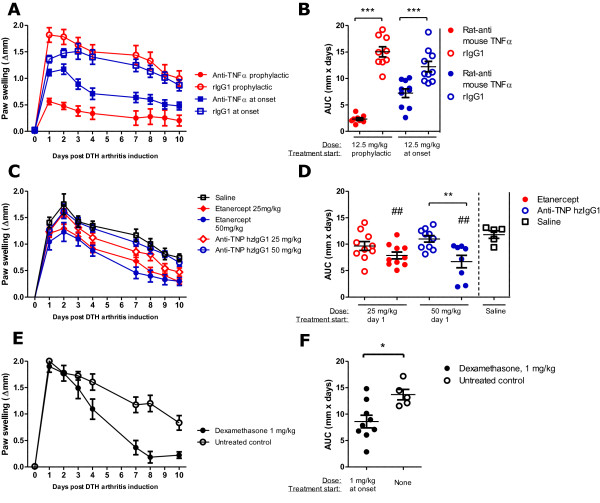
Conclusions: Our findings indicate that DTH-arthritis shares features with both collagen-induced arthritis (CIA) and human RA. DTH-arthritis is dependent on CD4+ cells for induction and can be successfully treated with TNFα-blocking biologics and dexamethasone. On the basis of our findings we believe that the DTH-arthritis model could hold potential in the preclinical screening of novel drugs targeting RA. The model is highly reproducible and has a high incidence rate with synchronised onset and progression, which strengthens its potential.


Figures

Figure 1
Figure 1
Establishment and assessment of the delayed-type hypersensitivity (DTH)-arthritis model. (a) Protocol for induction of DTH arthritis in mice. (b) Paw swelling (calculated as Δpaw swelling = left paw swelling - right paw swelling) on days 0 to 28 after antigen (Ag) challenge for the group that received anti-type II collagen antibody cocktail (anti-CII) + challenge. For the other two groups, paw swelling until day 14 after arthritis induction is shown. Mean ± standard error of the mean (SEM) is displayed (n = 9 per group). (c) Clinical score of the Ag-challenged paw on days 0 to 28 after Ag challenge for the group that received anti-CII + challenge. For the other two groups, area under the curve (AUC) of the paw swelling until day 14 after arthritis induction is shown. The median is shown (n = 9 per group). (d) Titration of anti-CII. AUC for days 0 to 11 after DTH-arthritis induction is shown for the groups receiving anti-CII + challenge. For the group receiving anti-CII and no challenge and the group receiving isotype cocktail and challenge, AUC for days 0 to 9 after DTH-arthritis induction is shown. Mean ± SEM is shown (n = 6 to 19 per group). (e) Ag-specific proliferation assay of cells isolated from the popliteal lymph node draining either the Ag-challenged or the phosphate-buffered saline (PBS)-challenged paw from mice receiving either anti-CII or isotype cocktail. Counts per minute (CPM) relative to the degree of 3H incorporation are shown with mean ± SEM (n = 3) in triplicate wells. (f) Serum levels of interleukin-6 (IL-6) on selected time points after DTH-arthritis induction. Mean ± SEM is shown (n = 5 per time point). (g) Serum levels of acute-phase protein serum amyloid P component (SAP) on selected time points after DTH-arthritis induction. Mean ± SEM is shown (n = 5 per time point). ***P ≤ 0.001. αCII, anti-type II collagen monoclonal antibody cocktail; i.v., intravenous; mAb, monoclonal antibody; mBSA, methylated bovine serum albumin.
Figure 2
Figure 2
Development of severe arthritis in mice with delayed-type hypersensitivity (DTH) arthritis. (a) Histochemical stains for the osteoclast-specific enzyme tartrate-resistant acid phosphatase (TRAP). Osteoclasts appear red. Arrows indicate areas with increased osteoclast numbers and bone erosion. (b) Histochemical stain using the Safranin O protocol. Cartilage proteoglycan is stained red, and the intensity of the red color is proportional to the proteoglycan content of cartilage. Arrows indicate areas displaying cartilage loss, which is most prominent in the uncalcified cartilage. Mice with DTH arthritis developed severe arthritis characterized by increased cartilage degradation (as assessed by loss of Safranin O staining) and osteoclast activity (as assessed by the increase in TRAP-positive cells) and bone erosion; synovitis and pannus formation is also observed. The sections shown in (a) and (b) are representative of mice with DTH arthritis (immunization, anti-type II collagen antibody cocktail (anti-CII), and antigen challenge) and of mice receiving immunization, anti-CII, and no challenge (control). Samples were taken on days 2, 4, 7, 9, and 14. (c) Osteophyte shown on day 14 after DTH-arthritis induction. Hematoxylin and eosin staining was used. B, bone; BM, bone marrow; O, osteophyte. (d) Total sum score of histopathological changes from days 2 to 14 after DTH-arthritis induction. Maximum possible score is 15. Mean ± standard error of the mean (SEM) is shown (n = 3 to 5). (e) The score for extra-articular inflammatory infiltration from days 2 to 14 after DTH-arthritis induction. Maximum possible score is 3. Mean ± SEM is shown (n = 3 to 5). (f) Sum score of arthritic changes (calculated as total sum score of histopathological changes from which the score for extra-articular inflammatory infiltration has been subtracted) from days 2 to 14 after DTH-arthritis induction. Maximum possible score is 12. Mean ± SEM is shown (n = 3 to 5). Details of the histopathological scoring system can be found in the Materials and methods section.
Figure 3
Figure 3
Composition of the inflammatory infiltrate in delayed-type hypersensitivity (DTH) arthritis. (a) Representative immunohistochemical stains for F4/80+ cells and hematoxylin and eosin (H&E) stains from mice receiving immunization, anti-type II collagen antibody cocktail (anti-CII), and challenge. Samples were taken on days 1 (F4/80+), 2 (H&E), 7, and 14 after DTH-arthritis induction. Unchallenged control samples are from mice receiving immunization, anti-CII, and no challenge. Mice with DTH arthritis displayed severe inflammation characterized by an infiltration of neutrophils and F4/80+ cells into the soft tissue and intra-articular space; neutrophils dominated in the early stages and in the intra-articular space. Severe hyperplasia of the synovial membrane and pannus formation were also observed. (b) Flow cytometric analysis of inflammatory infiltrate isolated from inflamed paws. Cell subsets are displayed both as fraction of total live CD45+ cells and as absolute numbers per paw. Cells were gated on singlets, live cells, and CD45+, and cell subsets were defined as follows: neutrophils: Ly6G+CD11bintermediate-high; macrophages: F4/80+CD11b+Ly6G-; dendritic cells (DCs): CD11b+CD11c+; T cells: TcRβ+; B cells: CD19+. Median ± range is shown (n = 5). *P ≤ 0.05, **P ≤ 0.01. TcRβ+, T-cell receptor-beta-positive.
Figure 4
Figure 4
The delayed-type hypersensitivity (DTH)-arthritis inflammatory response is dependent on CD4+ T cells. The response is dependent on CD4+ cells and independent of CD8+ cells, as demonstrated by the failure of mice depleted of CD4+ cells to develop a paw swelling response and the ability of mice depleted of CD8+ cells to develop a paw swelling response no different than that of the phosphate-buffered saline (PBS)-treated control group. (a) Paw swelling measured over days 0 to 9 after DTH-arthritis induction. Mean ± standard error of the mean (SEM) is shown (n = 6 to 10 per group). (b) Area under the curve (AUC) of paw swelling based on paw swelling data from days 0 to 9 after arthritis induction. Mean ± SEM is shown (n = 6 to 10 per group). ***P ≤ 0.001. (c) Percentage of CD4+ cells of total T-cell receptor-beta-positive (TCRβ+) cells measured on days -7 and 9 after DTH-arthritis induction shown for mice receiving anti-CD4 monoclonal antibody (mAb) or PBS on days -8 and -1. The data show that CD4+ cells were efficiently depleted. Cells were gated on CD45 and TCRβ. Mean ± SEM is shown (n = 6 to 10 per group). (d) Percentage of CD8+ cells of total TCRβ+ cells measured on days -7 and 9 after DTH-arthritis induction shown for mice receiving anti-CD8 mAb or PBS on days -8 and -1. The data show that CD8+ cells were efficiently depleted. Cells were gated on CD45 and TCRβ. Mean ± SEM is shown (n = 6 to 10 per group). (e) Representative flow cytometry plots from the depletion check on day -7 demonstrating the efficiency of the depleting mAbs. Cells were gated on CD45 and TCRβ. The circled populations represent the remaining percentage of either CD4+ or CD8+ cells of total TCRβ+ cells.
Figure 5
Figure 5
Local profile of inflammatory mediators in the delayed-type hypersensitivity (DTH)-arthritis response. Levels were measured by multiplex bead-based luminex analysis on homogenate supernatants from whole paws taken at 12, 24, and 48 hours and 4, 9, and 14 days after induction of DTH arthritis (n = 5 per time point). The line represents the median. *P ≤ 0.05, **P ≤ 0.01, compared with control value. CXCL, chemokine (C-X-C motif) ligand; IFNγ, interferon-gamma; IL, interleukin; IP-10, interferon-gamma inducible protein 10; MCP-1, monocyte chemo attractant protein 1; RANKL, receptor activator of nuclear factor kappa-B ligand; TNFα, tumor necrosis factor-alpha.
Figure 6
Figure 6
Paw swelling response in delayed-type hypersensitivity (DTH) arthritis following treatment with tumor necrosis factor alpha (TNFα)-blocking biologics or dexamethasone. (a, b) Rat anti-mouse TNFα mAb (anti-TNFα) was administered from the time of immunization (prophylactic), and control groups received rat IgG1 (rIgG1). Mean ± standard error of the mean (SEM) is shown (n = 9 to 10 per group). Area under the curve (AUC) was calculated from days 0 to 10 after arthritis induction. Both prophylactic treatment and treatment at onset with anti-TNFα resulted in a significant reduction in the footpad swelling response. (c, d) Etanercept, a soluble TNF receptor fused to the Fc part of human IgG, was administered therapeutically (from day 1), and control groups received humanized anti-trinitrophenol (anti-TNP hzIgG1). A vehicle (saline) control group was also included. Mean ± SEM is shown (n = 9 to 10 per group). AUC was calculated from days 0 to 10 after arthritis induction. Therapeutic treatment with etanercept resulted in a significant reduction in footpad swelling when administered at 50 mg/kg. Treatment with 25 and 50 mg/kg both resulted in a significant reduction in the footpad swelling response when compared with the saline control group (indicated by ##). (e, f) Dexamethasone, a glucocorticoid, was administered daily from time of disease onset, and control groups received no treatment. Mean ± SEM is shown (n = 9 to 10 per group). AUC was calculated from days 0 to 10 after arthritis induction. Daily treatment with dexamethasone from time of disease onset significantly reduced the paw swelling response when compared with the untreated control group. The levels of significance are defined as follows: *P ≤ 0.05, **P ≤ 0.01, ***P ≤ 0.001, ##P ≤ 0.01.
Figure 7
Figure 7
Effect of treatment with TNFα blocking biologics on histology, systemic and local inflammatory parameters. (a, b) Rat anti-mouse tumor necrosis factor-alpha monoclonal antibody (anti-TNFα) treatment led to a significant reduction in both the histology sum score and the individual parameters of the sum score in comparison with the control group. *P ≤ 0.05, **P ≤ 0.01, ***P ≤ 0.001. (c) Local profile of inflammatory mediators following administration of anti-TNFα (n = 5 per time point). Median and range are shown. Dotted line represents levels measured in naïve mice (n = 5). *P ≤ 0.05, **P ≤ 0.01, ***P ≤ 0.001, compared with value obtained from the mBSA-challenged paws taken from the isotype control group. #P ≤ 0.05, ##P ≤ 0.01, ###P ≤ 0.001, compared with the value obtained from the contralateral phosphate-buffered saline (PBS)-challenged paws taken from animals receiving identical treatments. (d) Serum levels of serum amyloid P component (SAP) in mice given prophylactic treatment with either anti-TNFα or isotype control antibody. Mean ± standard error of the mean (SEM) is shown (n = 5). **P ≤ 0.01, compared with the control group. Dotted line represents levels measured in naïve mice (n = 5). (e) Serum levels the enzyme MMP3 in mice given prophylactic treatment with either anti-TNFα mAb or isotype control antibody (rIgG1). Mean ± SEM is shown (n = 5). Dotted line represents levels measured in naïve mice (n = 5). **P ≤ 0.01, ***P ≤ 0.001, compared with the control group. CXCL, chemokine (C-X-C motif) ligand; IFNγ, interferon-gamma; IL, interleukin; MCP-1, monocyte chemo attractant protein 1; MMP3, matrix metalloproteinase 3; RANKL, receptor activator of nuclear factor kappa-B ligand; SAP, serum amyloid P component.

Similar articles

Cited by

References

    1. Klareskog L, Catrina AI, Paget S. Rheumatoid arthritis. Lancet. 2009;373:659–672. doi: 10.1016/S0140-6736(09)60008-8. - DOI - PubMed
    1. Feldmann M, Maini RN. Anti-TNF therapy, from rationale to standard of care: What lessons has it taught us? J Immunol. 2010;185:791–794. doi: 10.4049/jimmunol.1090051. - DOI - PubMed
    1. McInnes IB, O'Dell JR. State-of-the-art: rheumatoid arthritis. Ann Rheum Dis. 2010;69:1898–1906. doi: 10.1136/ard.2010.134684. - DOI - PubMed
    1. Kollias G, Papadaki P, Apparailly F, Vervoordeldonk MJ, Holmdahl R, Baumans V, Desaintes C, Di Santo J, Distler J, Garside P, Hegen M, Huizinga TW, Jüngel A, Klareskog L, McInnes I, Ragoussis I, Schett G, Hart B, Tak PP, Toes R, van den Berg W, Wurst W, Gay S. Animal models for arthritis: innovative tools for prevention and treatment. Ann Rheum Dis. 2011;70:1357–1362. doi: 10.1136/ard.2010.148551. - DOI - PubMed
    1. van den Berg WB. Lessons from animal models of arthritis over the past decade. Arthritis Res Ther. 2009;11:250. doi: 10.1186/ar2803. - DOI - PMC - PubMed

Publication types

MeSH terms