. 2012 Oct 10;21(15):2753-61.
doi: 10.1089/scd.2011.0660. Epub 2012 Jul 16.

The cancer stem cell subtype determines immune infiltration of glioblastoma

Affiliations

The cancer stem cell subtype determines immune infiltration of glioblastoma

Christoph P Beier et al. Stem Cells Dev. .

Abstract

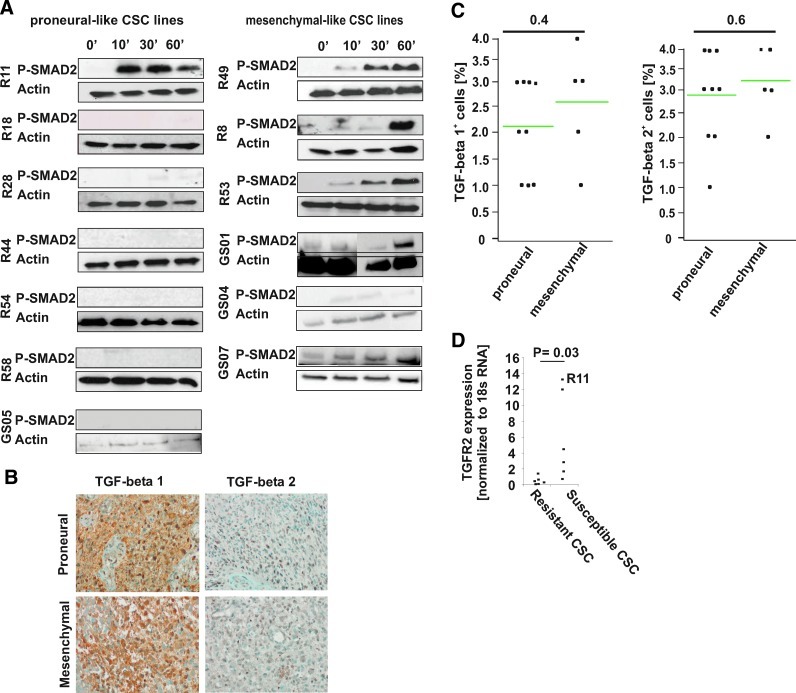
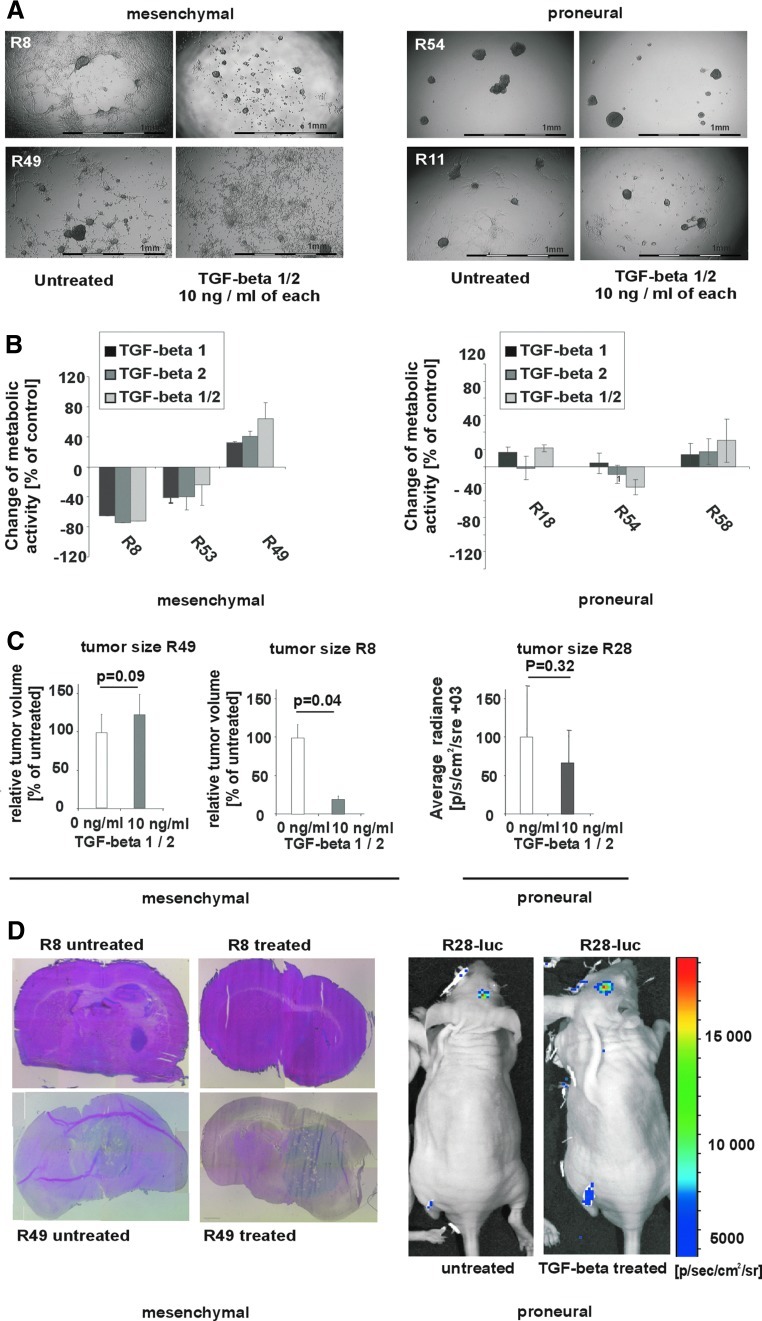
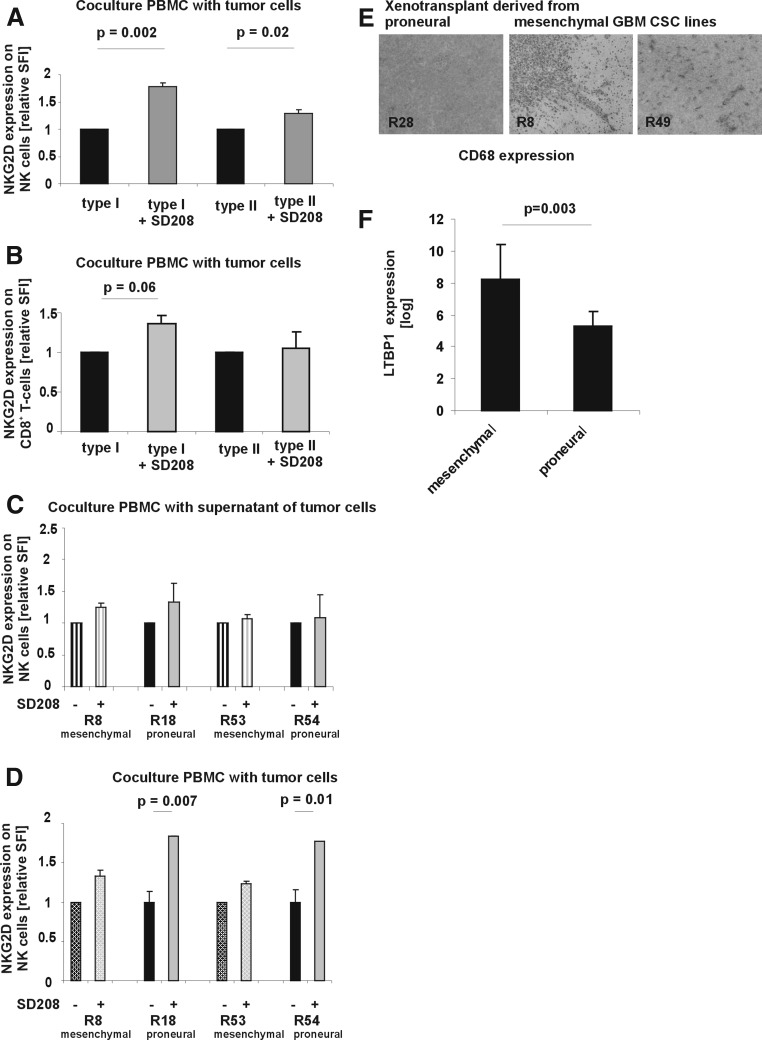
Immune cell infiltration varies widely between different glioblastomas (GBMs). The underlying mechanism, however, remains unknown. Here we show that TGF-beta regulates proliferation, migration, and tumorigenicity of mesenchymal GBM cancer stem cells (CSCs) in vivo and in vitro. In contrast, proneural GBM CSCs resisted TGF-beta due to TGFR2 deficiency. In vivo, a substantially increased infiltration of immune cells was observed in mesenchymal GBMs, while immune infiltrates were rare in proneural GBMs. On a functional level, proneural CSC lines caused a significantly stronger TGF-beta-dependent suppression of NKG2D expression on CD8(+) T and NK cells in vitro providing a mechanistic explanation for the reduced immune infiltration of proneural GBMs. Thus, the molecular subtype of CSCs TGF-beta-dependently contributes to the degree of immune infiltration.


Figures

FIG. 1.
FIG. 1.
Responsiveness to TGF-beta in proneural- and mesenchymal-like cancer stem cell (CSC) lines. (A) SMAD2 phosphorylation after incubation with TGF-beta 1 and 2 (10 ng/mL) for 0, 10, 30, and 60 min was analyzed by immunoblotting. Beta-actin was included as loading control. (B, C) TGF-beta 1 and TGF-beta 2 expression in glioblastoma (GBM) (n=19, same tumors as in Fig. 5). The percentage of TGF-beta expressing cells was scored as described in the Materials and Methods section. There was no significant difference in the number of TGF-beta expressing cells between proneural and mesenchymal GBMs (one-sided t-test). (D) Relative TGF-betaR2 mRNA expression normalized to 18S RNA is given in CSC lines with and without SMAD2 phosphorylation (*P=0.03; one-sided t-test). Color images available online at www.liebertpub.com/scd
FIG. 2.
FIG. 2.
Comparison of TGF-beta effects in proneural-like and mesenchymal-like CSC lines. (A) The growth pattern and (B) proliferation of mesenchymal-like and proneural-like CSC lines after incubation with 10 ng/mL TGF-beta 1 and 2 or solvent control for 7 days is shown. The following CSC lines showed a similar response pattern: R8, R53, GS01, GS04, GS07 (growth inhibition); R49 (growth promotion); R11, R18, R28, R44, R54, R58, GS05 (no response). The change of proliferation and images of representative CSC lines were given. (B) To determine the growth rate, 5,000 cells per well were seeded in a 96-well plate. The relative change of the metabolic activity (as determined by AlamarBlue) after treatment with TGF-beta for 7 days as compared to untreated control is given (R8/R53: also reported in [8]). (C) CSC lines R49 (left panel), R8 (middle panel), and R28-luc (described in Ref. [11], right panel) were treated or not with TGF-beta for 7 days before 2×10⁵ viable cells were inoculated into nude mice. After 10 weeks (R8, R49), animals were sacrificed, 10-μm tumor sections were stained with hematoxylin and eosin, and the maximum tumor area was determined using a caliper. Tumor volumes obtained with TGF-beta treated cells are given relative to tumor volumes of lesions grown from untreated GBM CSC. The number of tumor cells of R28-luc was determined by bioluminescence ([11], P values: two-sided t-test). (D) Representative pictures of the tumors are shown. Color images available online at www.liebertpub.com/scd
FIG. 3.
FIG. 3.
Only GBMs resembling mesenchymal-like CSCs express TGF-beta-induced transcripts. (A) To identify TGF-beta-induced transcripts, 100 differentially regulated transcripts were determined by comparing microarrays (Affymetrix U133 plus 2.0) of TGF-beta treated and untreated R8/R53 cells (TGF-beta target genes). Clustering experiments were then performed on the data set comprising 80 primary GBMs, as published by Murat et al. [13]. To show that clusters were not driven by random expression fluctuations, we used consensus clustering ([8]). Dark color corresponds to pairs that were never clustered together, while bright color corresponds to pairs that were always clustered together. The infrequent intermediate counts are represented by a color gradient. (B) The same 80 GBMs as in (A) were sorted according to the mesenchymal versus proneural 24-gene signature index in increasing order (lower bar). The color of the upper bar gives the index of the TGF-beta target genes with dark colored/red indicating TGF-betaresponsive and bright colored/green indicating TGF-betaunresponsive GBMs. Color images available online at www.liebertpub.com/scd
FIG. 4.
FIG. 4.
Proneural-like CSC lines downregulate NKG2D receptor expression on CD56+ NK and CD8+ T cells in a TGF-beta-dependent manner. 1.5×10⁶ PBMC were cocultured with 1.5×10⁵ proneural-like (R18, R54) or mesenchymal-like CSC lines (R8, R53) (A, B, D) or supernatant of the GBM CSC lines (C) for 48 h in 500 μl of the CSC medium in the absence or presence of SD-208 (1 μM) as indicated (two-sided t-test). NKG2D receptor expression on NK cells (A, C, D) and CD8 T cells (B) was determined by flow cytometry (two-sided t-test). Expression levels are indicated as specific fluorescence intensities (SFI) obtained by dividing the fluorescence intensity detected with the specific antibody by the fluorescence signal measured with the isotype control antibody. (E) Xenograft tumors from R8, R49, and R28 CSC lines were stained for infiltrating CD68+ microglia cells. Representative pictures are shown. (F) The expression of latent TGF-beta binding protein 1 (which sequesters latent TGF-beta in the extracellular matrix of GBM cells) is given. Shown are average values from 6 mesenchymal and 7 proneural GBM CSC lines (P value, two-sided Student's-t-test).
FIG. 5.
FIG. 5.
Proneural and mesenchymal GBMs show different levels of infiltration by immune cells. (A) Human GBMs were stained for infiltrating CD8+ and CD68+ cells. Counting of the stained cells revealed substantial differences. (B) Expression of markers for proneural GBMs (Olig2, DLL3, NeuN), mesenchymal GBMs (YKL-40, CD44, VEGF), and infiltrating immune cells (CD8 and CD68) were quantified in 19 human GBMs. We then calculated a proneural/mesenchymal index (see Material and Methods section and Supplementary Fig. S1). The representative stainings for Olig 2 expression, infiltrating CD8, and CD68 cells are displayed. (C) The variable immune infiltration score observed in the stained GBM was correlated with the proneural/mesenchymal index. (D) The number of infiltrating CD8+ and CD68+ immune cells per high-power field was plotted for mesenchymal (n=10) and proneural (n=9) GBM. Statistical differences were assessed by the Student's two-sided t-test. Color images available online at www.liebertpub.com/scd

References

    1. Li A. Walling J. Ahn S. Kotliarov Y. Su Q. Quezado M. Oberholtzer JC. Park J. Zenklusen JC. Fine HA. Unsupervised analysis of transcriptomic profiles reveals six glioma subtypes. Cancer Res. 2009;69:2091–2099. - PMC - PubMed
    1. Huse JT. Phillips HS. Brennan CW. Molecular subclassification of diffuse gliomas: seeing order in the chaos. Glia. 2011;59:1190–1199. - PubMed
    1. Phillips HS. Kharbanda S. Chen R. Forrest WF. Soriano RH. Wu TD. Misra A. Nigro JM. Colman H, et al. Molecular subclasses of high-grade glioma predict prognosis, delineate a pattern of disease progression, and resemble stages in neurogenesis. Cancer Cell. 2006;9:157–173. - PubMed
    1. Verhaak RG. Hoadley KA. Purdom E. Wang V. Qi Y. Wilkerson MD. Miller CR. Ding L. Golub T, et al. Integrated genomic analysis identifies clinically relevant subtypes of glioblastoma characterized by abnormalities in PDGFRA, IDH1, EGFR, and NF1. Cancer Cell. 2010;17:98–110. - PMC - PubMed
    1. Brennan C. Momota H. Hambardzumyan D. Ozawa T. Tandon A. Pedraza A. Holland E. Glioblastoma subclasses can be defined by activity among signal transduction pathways and associated genomic alterations. PLoS One. 2009;4:e7752. - PMC - PubMed

Publication types

MeSH terms

Substances