. 2012 Jun 8:13:225.
doi: 10.1186/1471-2164-13-225.

Probing the Xenopus laevis inner ear transcriptome for biological function

Affiliations

Probing the Xenopus laevis inner ear transcriptome for biological function

TuShun R Powers et al. BMC Genomics. .

Abstract

Background: The senses of hearing and balance depend upon mechanoreception, a process that originates in the inner ear and shares features across species. Amphibians have been widely used for physiological studies of mechanotransduction by sensory hair cells. In contrast, much less is known of the genetic basis of auditory and vestibular function in this class of animals. Among amphibians, the genus Xenopus is a well-characterized genetic and developmental model that offers unique opportunities for inner ear research because of the amphibian capacity for tissue and organ regeneration. For these reasons, we implemented a functional genomics approach as a means to undertake a large-scale analysis of the Xenopus laevis inner ear transcriptome through microarray analysis.

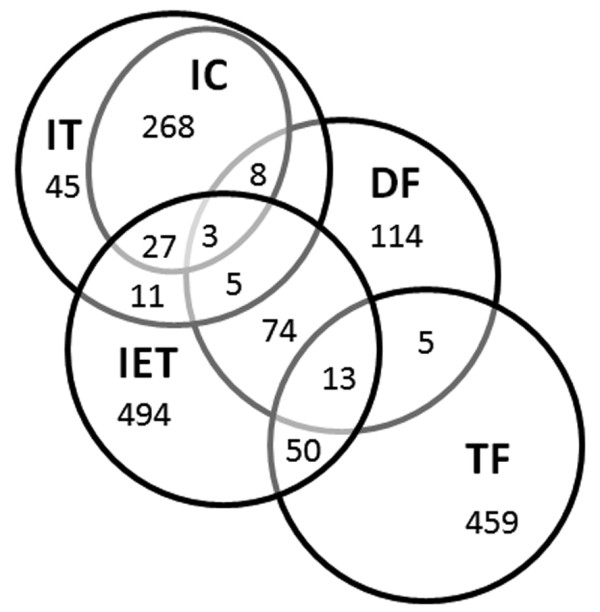
Results: Microarray analysis uncovered genes within the X. laevis inner ear transcriptome associated with inner ear function and impairment in other organisms, thereby supporting the inclusion of Xenopus in cross-species genetic studies of the inner ear. The use of gene categories (inner ear tissue; deafness; ion channels; ion transporters; transcription factors) facilitated the assignment of functional significance to probe set identifiers. We enhanced the biological relevance of our microarray data by using a variety of curation approaches to increase the annotation of the Affymetrix GeneChip(®) Xenopus laevis Genome array. In addition, annotation analysis revealed the prevalence of inner ear transcripts represented by probe set identifiers that lack functional characterization.

Conclusions: We identified an abundance of targets for genetic analysis of auditory and vestibular function. The orthologues to human genes with known inner ear function and the highly expressed transcripts that lack annotation are particularly interesting candidates for future analyses. We used informatics approaches to impart biologically relevant information to the Xenopus inner ear transcriptome, thereby addressing the impediment imposed by insufficient gene annotation. These findings heighten the relevance of Xenopus as a model organism for genetic investigations of inner ear organogenesis, morphogenesis, and regeneration.


Figures

Figure 1
Figure 1
Normalization of X. laevis inner ear tissue (XIE) microarray data.A. Box plots of pre-normalized (A1) and GCRMA normalized (A2) Xl-PSID intensity data from three replicate XIE chips. B-D. MvA plots for pre-normalized (1) and GCRMA normalized (2) Xl-PSID intensity values representing the difference between chips XIE1-XIE2 (B), XIE1-XIE3 (C), and XIE2-XIE3 (D). Y axis (M, minus), differences in intensity for any given Xl-PSID from the two arrays. X axis (A, average), average intensity for a given Xl-PSID on the two arrays. Median and average IQR values for the Xl-PSID intensities are given on each plot.
Figure 2
Figure 2
RT-PCR analysis with Xenopus inner ear RNA.A. Electrophoresis gel of PCR products from RT-PCR reactions with template inner ear RNA. Lane 1: New England BioLabs 1 kb DNA ladder; Lane 2: No RT control with gata3 primers; Lane 3: No cDNA control with gata3 primers; Lane 4: gata3 amplified product; Lane 5: No cDNA control with clu primers; Lane 6: clu amplified product; Lane 7: No RT control with six1 primers; Lane 8: No cDNA control with six1 primers; Lane 9: six1 amplified product; Lane 10: No RT control with pfn2 primers; Lane 11: No cDNA control with pfn2 primers; Lane 12: pfn2 amplified product. B-C. Histograms of the average intensities of 105 Xl-PSID consensus sequences that formed affirmative pairwise alignments (BLASTN) with X. laevis (B, XE, n = 58) and X. tropicalis (C, TE, n = 58) inner ear cDNA library clones. Vertical line indicates an intensity value of four.
Figure 3
Figure 3
Venn diagram of the five inner ear gene categories. Venn diagram showing the number and overlap of HGNC or gene symbols within the five inner ear gene categories (see Additional file 2). The total number of symbols in each inner ear gene category are: 680 (IET); 222 (DF); 306 (IC); 367 (IT); and 527 (pTF). One gene symbol, NR3C1, was included in three gene lists (IET, 681; IT, 368; pTF, 528) and excluded from the diagram.
Figure 4
Figure 4
Histograms of Xl-PSID intensity values.A. Distribution of average Xl-PSID intensities for all experimental Xl-PSIDs (n =15, 491). Shaded areas are Xl-PSIDs with GCOS absent calls in all three replicates (n = 3, 314). B-F. Distribution of average intensities for Xl-PSIDs in the five gene categories: B, inner ear tissue (IET/Xl-PSIDs, n = 453); C, deafness (DF/Xl-PSIDs, n = 139); D, ion channel (IC/Xl-PSIDs, n = 74); E, ion transport (IT/Xl-PSIDs, n = 180); F, transcription factors (pTF/Xl-PSIDs, n = 795). Shaded areas are Xl-PSIDs with GCOS absent calls in all three replicates (B, IET/Xl-PSIDs, n = 92; C, DF/Xl-PSIDs, n = 33; D, IC/Xl-PSID, n = 22; E, IT/Xl-PSIDs, n = 52; F, pTF/Xl-PSIDs, n = 328). Vertical line separates the percentage of Xl-PSIDs intensities above and below four.
Figure 5
Figure 5
Decile analysis of inner ear gene category Xl-PSIDs. Bar graphs show the distribution Xl-PSIDs in each equal tally (A, number) or equal intensity (B, percentage) decile for IET/Xl-PSIDs (n = 361); DF/Xl-PSIDs (n = 106); IT/Xl-PSIDs (n = 128); pTF/Xl-PSIDs (n = 467). Note that IT/Xl-PSIDs includes both IC and IT genes.
Figure 6
Figure 6
BLAST analysis of gene category alignments Histograms showing the number of protein sequences for genes in three inner ear categories that aligned to Xl-PSID consensus sequences (Affy) or X. tropicalis 4.1 predicted proteins (Xt4.1 pp) using BLAST algorithms: A, IET/HGNC (n = 681); B, DF/HGNC (n = 222); C, IC/HGNC (n = 306). Pairwise alignments were sorted into similarity groups based on e-value (high = 0-10-100; mod = 10-99 to 10-50; weak = 10-49 to 10-15; low = E > 10-14, data not shown).

Similar articles

Cited by

References

    1. WHO. Deafness and hearing impairment. [ http://www.who.int/mediacentre/factsheets/fs300/en/]
    1. Statistics- Vestibular Disorders Association. Vertigo, Imbalance, Dizziness resources. [ http://www.vestibular.org/vestibular-disorders/statistics.php]
    1. Agrawal Y, Carey J, Della Santina C, Schubert M, Minor L. Disorders of balance and vestibular function in US adults: data from the National Health and Nutrition Examination Survey, 2001–2004. Arch Intern Med. 2009;169(10):938–944. doi: 10.1001/archinternmed.2009.66. - DOI - PubMed
    1. Quick Statistics (NIDCD Health Information)
    1. Holley M. Keynote review: The auditory system, hearing loss and potential targets for drug development. Drug Discov Today. 2005;10(19):1269–1282. doi: 10.1016/S1359-6446(05)03595-6. - DOI - PubMed

Publication types