. 2012 Jun 12;59(24):2206-16.
doi: 10.1016/j.jacc.2012.02.040.

Autonomic and hemodynamic origins of pre-hypertension: central role of heredity

Affiliations

Autonomic and hemodynamic origins of pre-hypertension: central role of heredity

Jason T Davis et al. J Am Coll Cardiol. .

Abstract

Objectives: The purpose of this study is to better understand the origins and progression of pre-hypertension.

Background: Pre-hypertension is a risk factor for progression to hypertension, cardiovascular disease, and increased mortality. We used a cross-sectional twin study design to examine the role of heredity in likely pathophysiological events (autonomic or hemodynamic) in pre-hypertension.

Methods: Eight hundred twelve individuals (337 normotensive, 340 pre-hypertensive, 135 hypertensive) were evaluated in a sample of twin pairs, their siblings, and other family members. They underwent noninvasive hemodynamic, autonomic, and biochemical testing, as well as estimates of trait heritability (the percentage of trait variance accounted for by heredity) and pleiotropy (the genetic covariance or shared genetic determination of traits) by variance components.

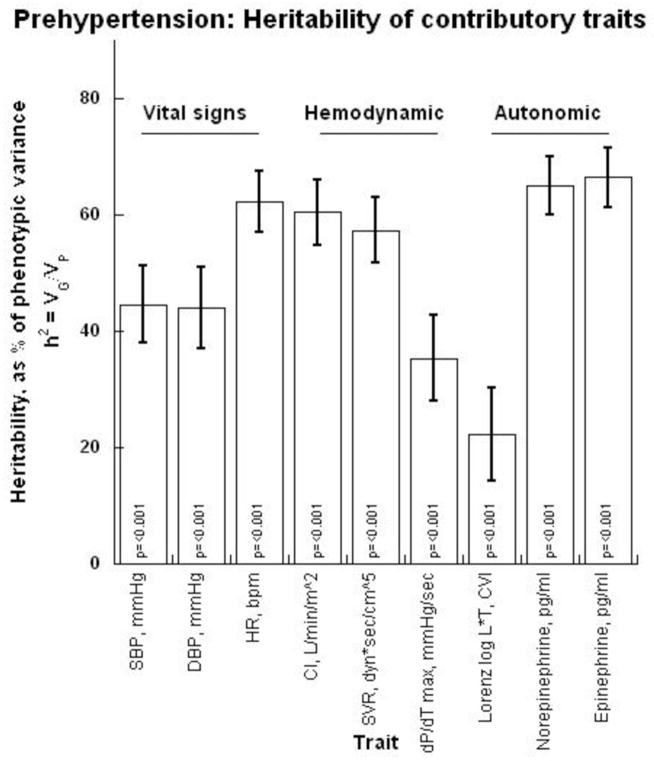
Results: In the hemodynamic realm, an elevation of cardiac contractility prompted increased stroke volume, in turn increasing cardiac output, which elevated blood pressure into the pre-hypertension range. Autonomic monitoring detected an elevation of norepinephrine secretion plus a decline in cardiac parasympathetic tone. Twin pair variance components documented substantial heritability as well as joint genetic determination for blood pressure and the contributory autonomic and hemodynamic traits. Genetic variation at a pathway locus also indicated pleiotropic effects on contractility and blood pressure.

Conclusions: Elevated blood pressure in pre-hypertension results from increased cardiac output, driven by contractility as well as heart rate, which may reflect both diminished parasympathetic and increased sympathetic tone. In the face of increased cardiac output, systemic vascular resistance fails to decline homeostatically. Such traits display substantial heritability and shared genetic determination, although by loci not yet elucidated. These findings clarify the role of heredity in the origin of pre-hypertension and its autonomic and hemodynamic pathogenesis. The results also establish pathways that suggest new therapeutic targets for pre-hypertension, or approaches to its prevention.


Figures

Figure 1
Figure 1. Prehypertension: Role of the heart and LV contractility
1a. SBP and DBP as a function of left ventricular contractility (as measured by LV dP/dT max) in normotensive, prehypertensive, and hypertensive groups. 1b. Scatter graph of all 813 individuals, with SBP shown as a function of left ventricular contractility, as measured by LV dP/dT max. Linear regression is shown as well. 1c. Pulse pressure (PP) elevation in prehypertension: Hemodynamic determinants. Average pulse pressure in normotensive, prehypertensive, and hypertensive groups vs. LV contractility as LV dP/dT max (solid line, right sided Y axis) and brachial artery distensibility (dashed line, left sided Y axis). Illustrates that increases in pulse pressure are due to a combination of the increase in LV contractility and the decrease in arterial distensibility.
Figure 2
Figure 2. Prehypertension: Role of the autonomic nervous system
2a. Sympathetic system and BP. Average plasma norepinephrine levels vs. average systolic and diastolic blood pressures in normotensive, prehypertensive, and hypertensive groups, with a line of best fit. 2b. Sympathetic system and LV contractility. Average plasma norepinephrine levels vs. average LV dP/dT max in normotensive, prehypertensive, and hypertensive groups. 2C. Parasympathetic system and heart rate. Scatter graph of basal heart rate vs. cardiac parasympathetic index, measured as Lorenz log10 [L*T]. Note that heart rate decreases as parasympathetic index increases. Linear regression line is also shown, and R2 value (coefficient of determination).
Figure 3
Figure 3. Prehypertension: Role of heredity
3a. Heritability (h2) of traits contributing to BP elevation: Results from twin pair variance components. 3b. Graphical representation of shared genetic (i.e., pleiotropic) vs. shared environmental effects on SBP. The other heritable traits are: SVR, CI, and LV dP/dT max. Above the diagonal line of identity (Y=X) lies primarily codetermination by environmental covariance (rE), while below the line lies primarily genetic covariance (rG). Each covariance is presented as mean ± SEM for the estimate. 3c. SBP as a function of contractility (LV dP/dT max) when stratified by CACNA1C rs2239050 genotype. Groups are composed of those with the G/G genotype (major allele homozygotes) vs. those with either the C/G or C/C genotypes.
Figure 4
Figure 4. Pathophysiology of prehypertension
Proposed hypothetical schema representing the pathophysiology of prehypertension and hypertension, based on data in this report. Individuals with genes causing susceptibility to hypertension eventually develop autonomic and biochemical traits which over time cause physiologic changes. These changes, such as increased CI with a failure of SVR to appropriately decrease, eventually manifest themselves as increased SBP and DBP.

Comment in

Similar articles

Cited by

References

    1. Chobanian AV, Bakris GL, Black HR, et al. The Seventh Report of the Joint National Committee on Prevention, Detection, Evaluation, and Treatment of High Blood Pressure: the JNC 7 report. Jama. 2003;289:2560–72. - PubMed
    1. Qureshi AI, Suri MF, Kirmani JF, Divani AA. Prevalence and trends of prehypertension and hypertension in United States: National Health and Nutrition Examination Surveys 1976 to 2000. Med Sci Monit. 2005;11:CR403–9. - PubMed
    1. Vasan RS, Larson MG, Leip EP, Kannel WB, Levy D. Assessment of frequency of progression to hypertension in non-hypertensive participants in the Framingham Heart Study: a cohort study. Lancet. 2001;358:1682–6. - PubMed
    1. Ogunniyi MO, Croft JB, Greenlund KJ, Giles WH, Mensah GA. Racial/ethnic differences in microalbuminuria among adults with prehypertension and hypertension: National Health and Nutrition Examination Survey (NHANES), 1999–2006. Am J Hypertens. 2010;23:859–64. - PubMed
    1. Ishikawa Y, Ishikawa J, Ishikawa S, et al. Prehypertension and the risk for cardiovascular disease in the Japanese general population: the Jichi Medical School Cohort Study. J Hypertens. 2010;28:1630–7. - PubMed

Publication types