

The structure of walking activity in people after stroke compared with older adults without disability: a cross-sectional study
- PMID: 22677293
- PMCID: PMC3432950
- DOI: 10.2522/ptj.20120034
The structure of walking activity in people after stroke compared with older adults without disability: a cross-sectional study
Abstract
Background: People with stroke have reduced walking activity. It is not known whether this deficit is due to a reduction in all aspects of walking activity or only in specific areas. Understanding specific walking activity deficits is necessary for the development of interventions that maximize improvements in activity after stroke.
Objective: The purpose of this study was to examine walking activity in people poststroke compared with older adults without disability.
Design: A cross-sectional study was conducted.
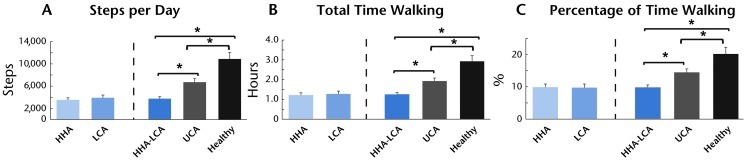
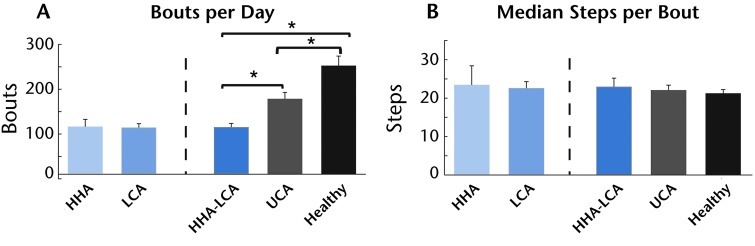
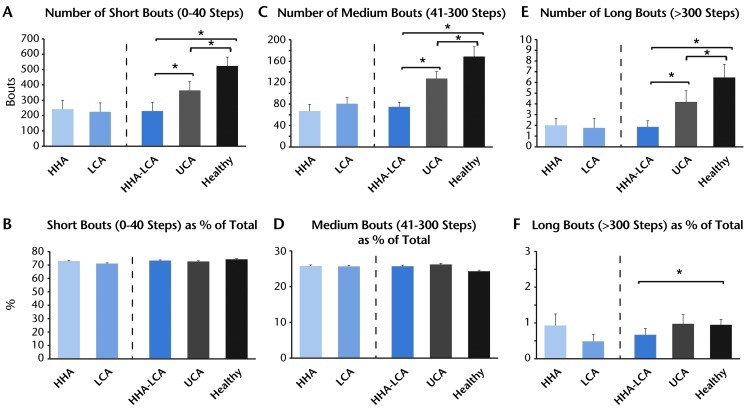
Methods: Fifty-four participants poststroke and 18 older adults without disability wore a step activity monitor for 3 days. The descriptors of walking activity calculated included steps per day (SPD), bouts per day (BPD), steps per bout (SPB), total time walking per day (TTW), percentage of time walking per day (PTW), and frequency of short, medium, and long walking bouts.
Results: Individuals classified as household and limited community ambulators (n=29) did not differ on any measure and were grouped (HHA-LCA group) for comparison with unlimited community ambulators (UCA group) (n=22) and with older adults without disability (n=14). The SPD, TTW, PTW, and BPD measurements were greatest in older adults and lowest in the HHA-LCA group. Seventy-two percent to 74% of all walking bouts were short, and this finding did not differ across groups. Walking in all categories (short, medium, and long) was lowest in the HHA-LCA group, greater in the UCA group, and greatest in older adults without disability.
Limitations: Three days of walking activity were captured.
Conclusions: The specific descriptors of walking activity presented provide insight into walking deficits after stroke that cannot be ascertained by looking at steps per day alone. The deficits that were revealed could be addressed through appropriate exercise prescription, underscoring the need to analyze the structure of walking activity.
Figures
References
-
- Lloyd-Jones D, Adams R, Carnethon M, et al. Heart disease and stroke statistics—2009 update: a report from the American Heart Association Statistics Committee and Stroke Statistics Subcommittee. Circulation. 2009;119:e21–e181 - PubMed
-
- Lees KR, Zivin JA, Ashwood T, et al. NXY-059 for acute ischemic stroke. N Engl J Med. 2006;354:588–600 - PubMed
-
- Mayo NE, Wood-Dauphinée S, Cote R, et al. Activity, participation, and quality of life 6 months poststroke. Arch Phys Med Rehabil. 2002;83:1035–1042 - PubMed
-
- Rimmer JH, Wang E. Aerobic exercise training in stroke survivors. Top Stroke Rehabil. 2005;12:17–30 - PubMed
-
- Hornnes N, Larsen K, Boysen G. Little change of modifiable risk factors 1 year after stroke: a pilot study. Int J Stroke. 2010;5:157–162 - PubMed
Publication types
MeSH terms
Grants and funding
LinkOut - more resources
Full Text Sources
Medical
Research Materials
