. 2012 Jul;5(7):911-20.
doi: 10.1158/1940-6207.CAPR-11-0544. Epub 2012 Jun 7.

Dietary methyl donor depletion protects against intestinal tumorigenesis in Apc(Min/+) mice

Affiliations

Dietary methyl donor depletion protects against intestinal tumorigenesis in Apc(Min/+) mice

Krishna Kadaveru et al. Cancer Prev Res (Phila). 2012 Jul.

Abstract

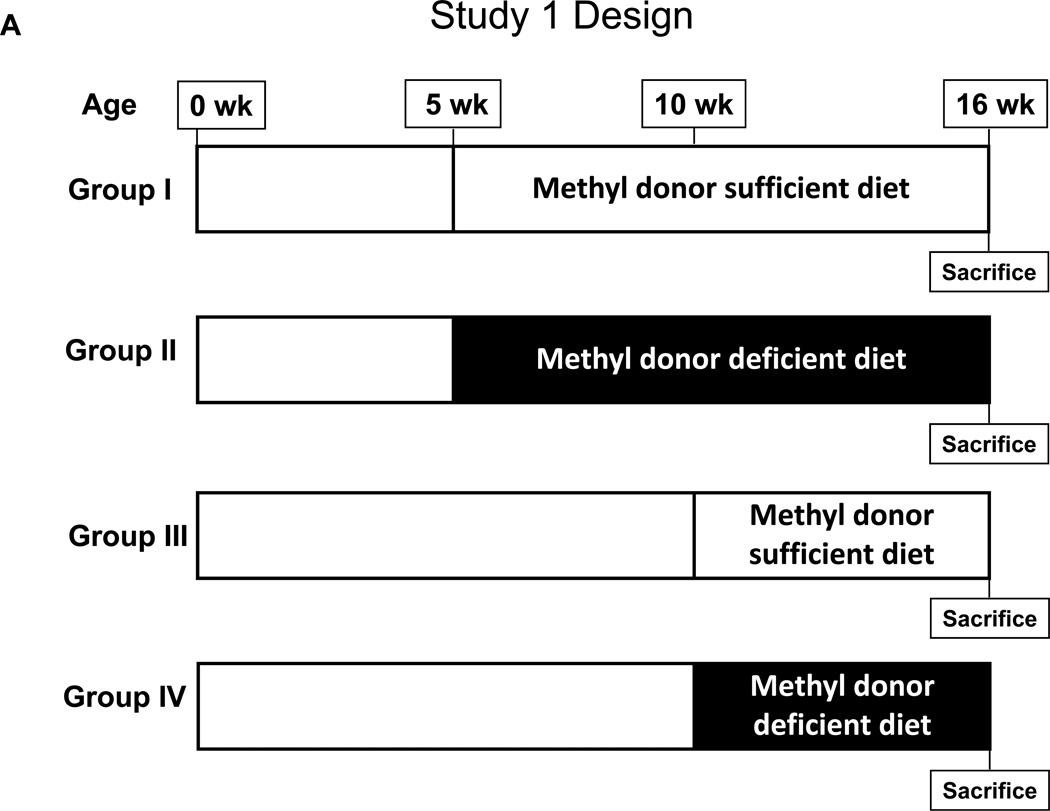
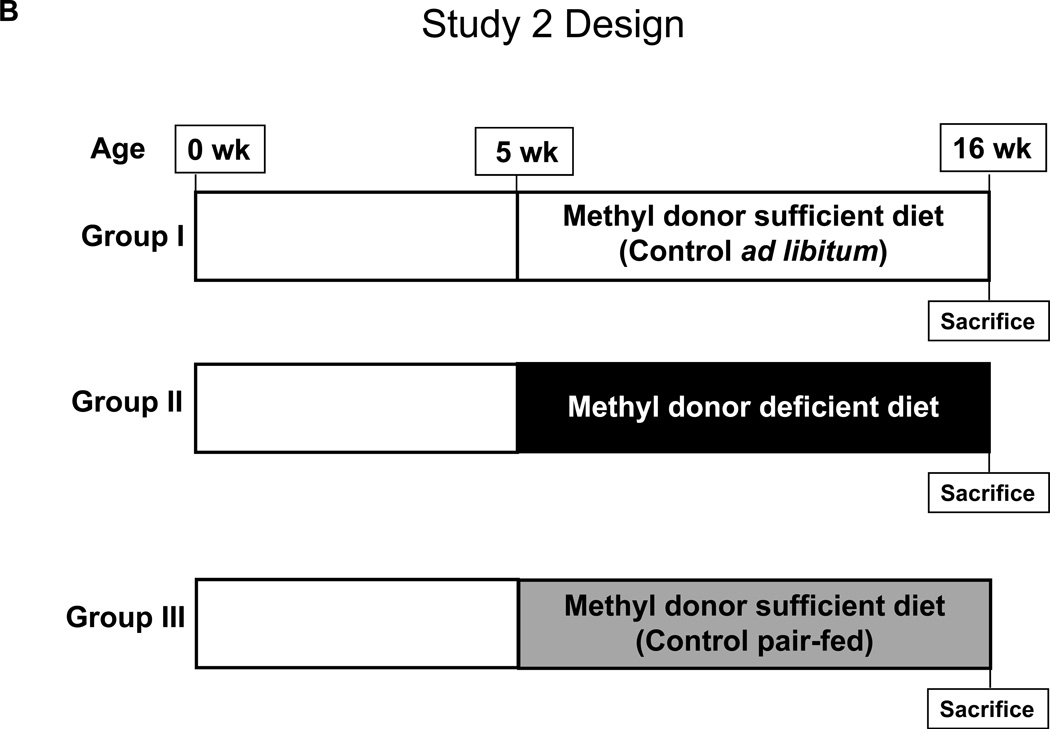
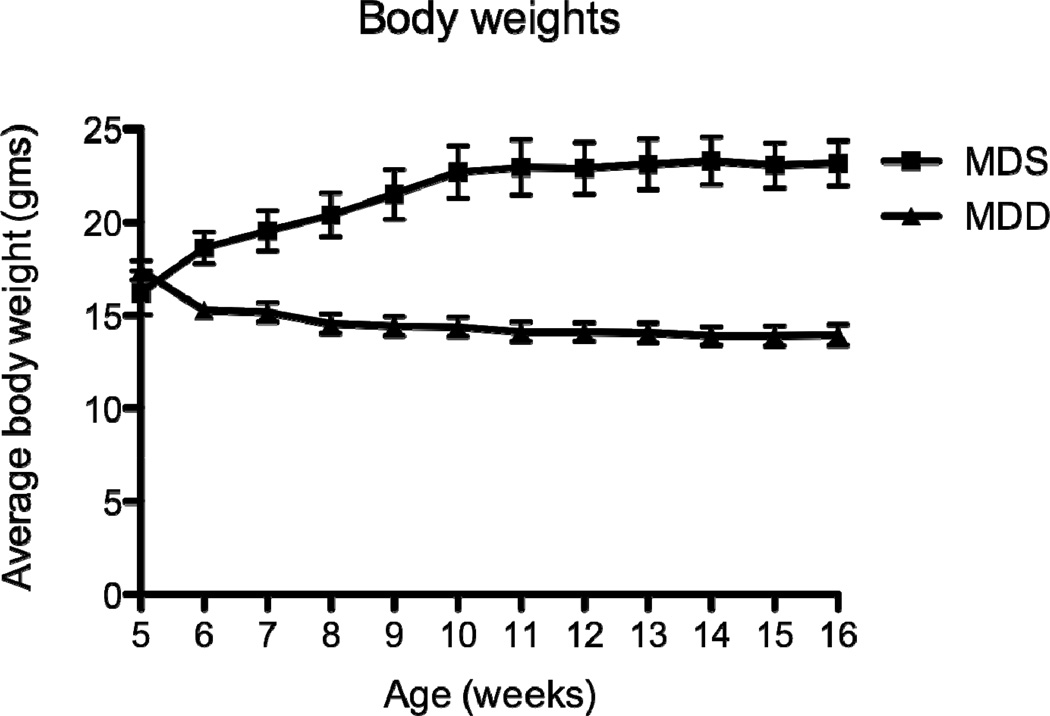
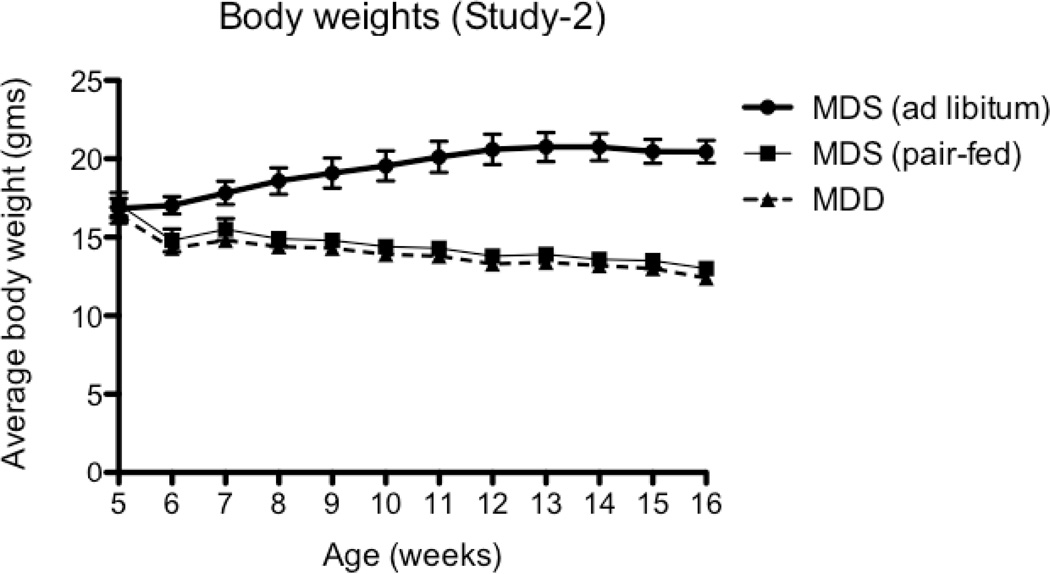
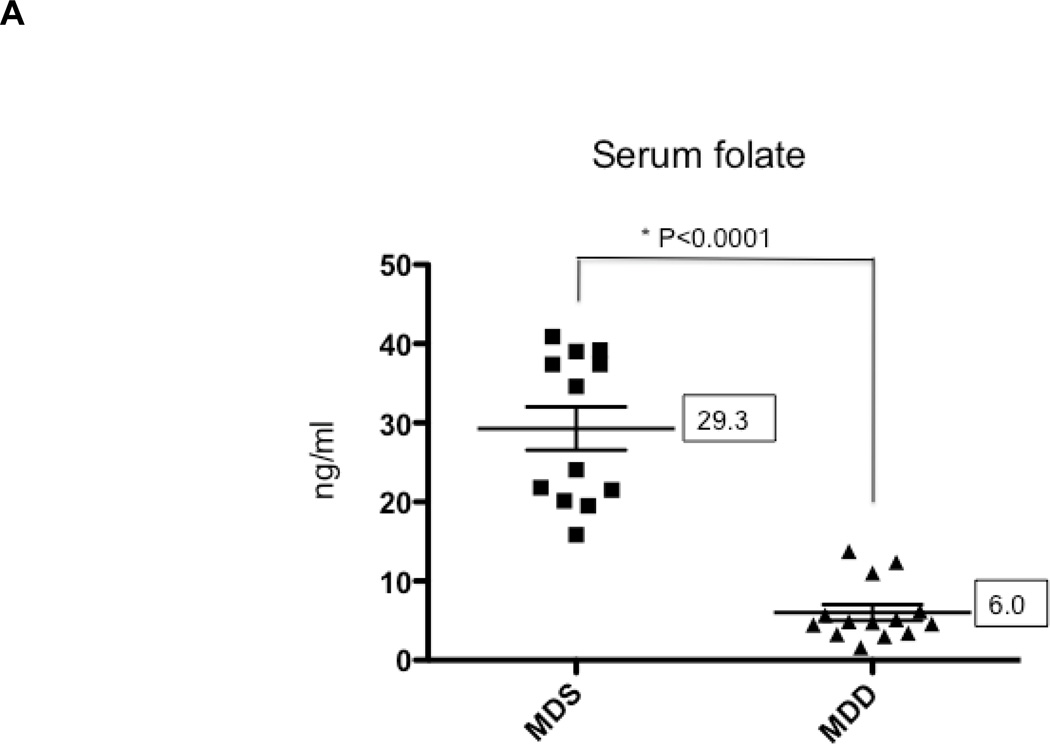
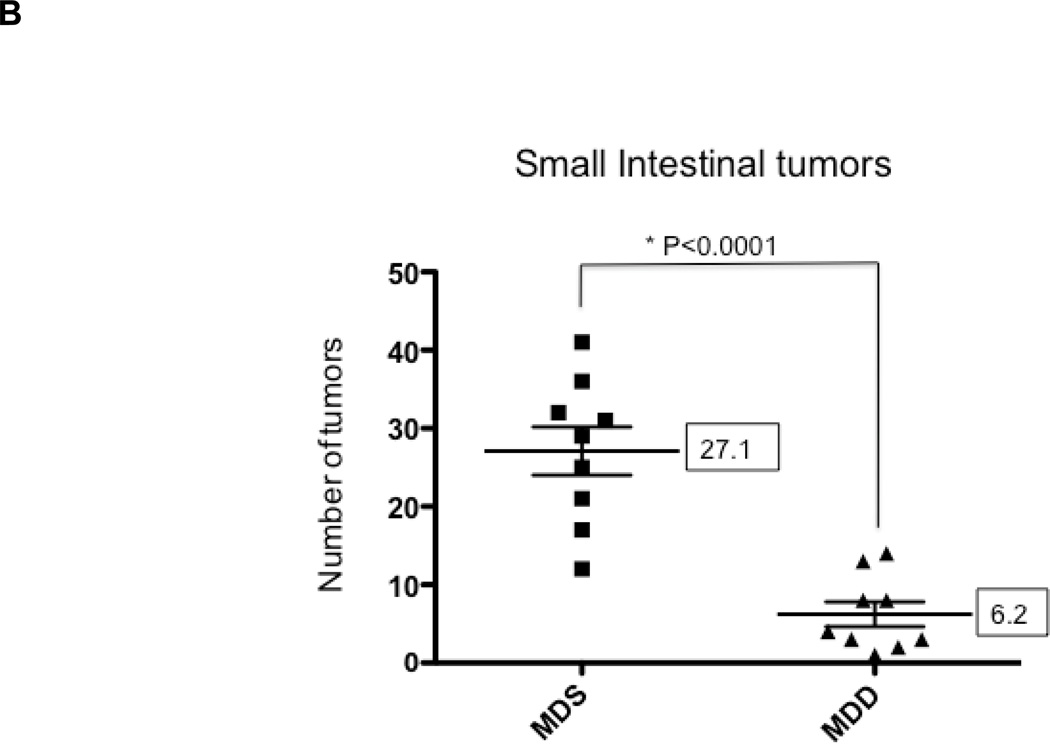
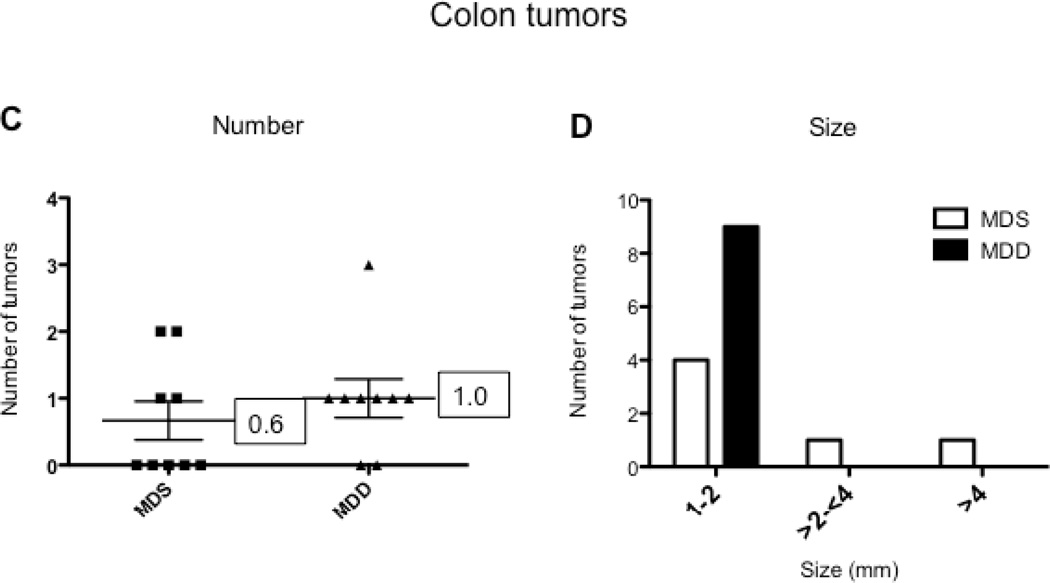
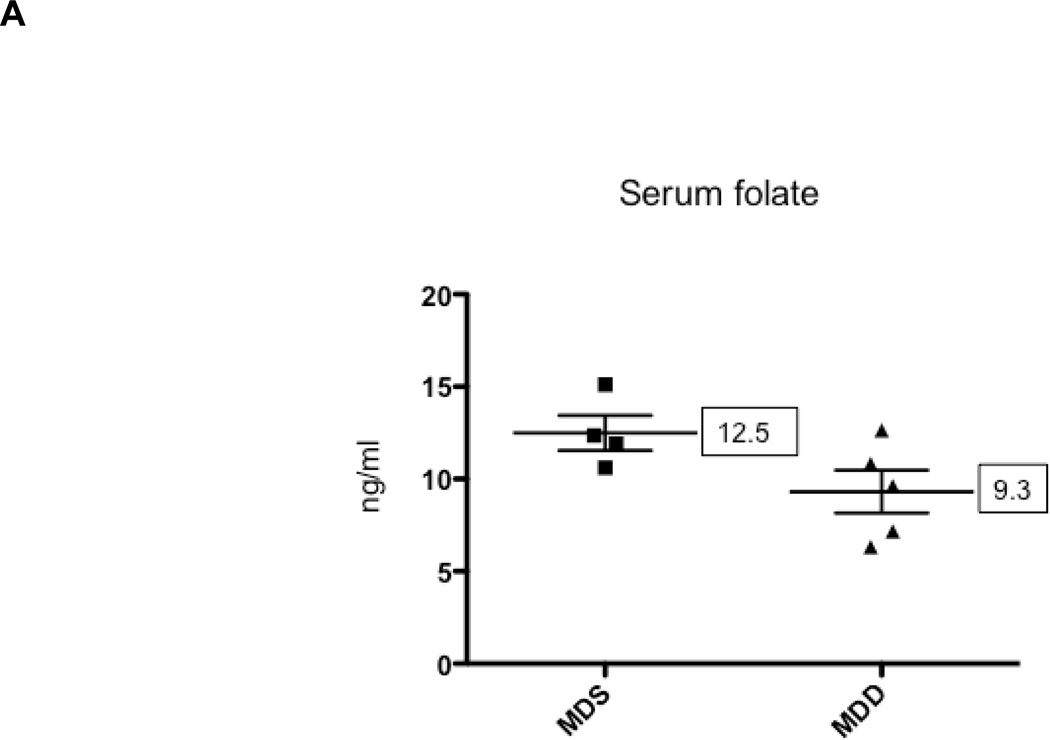
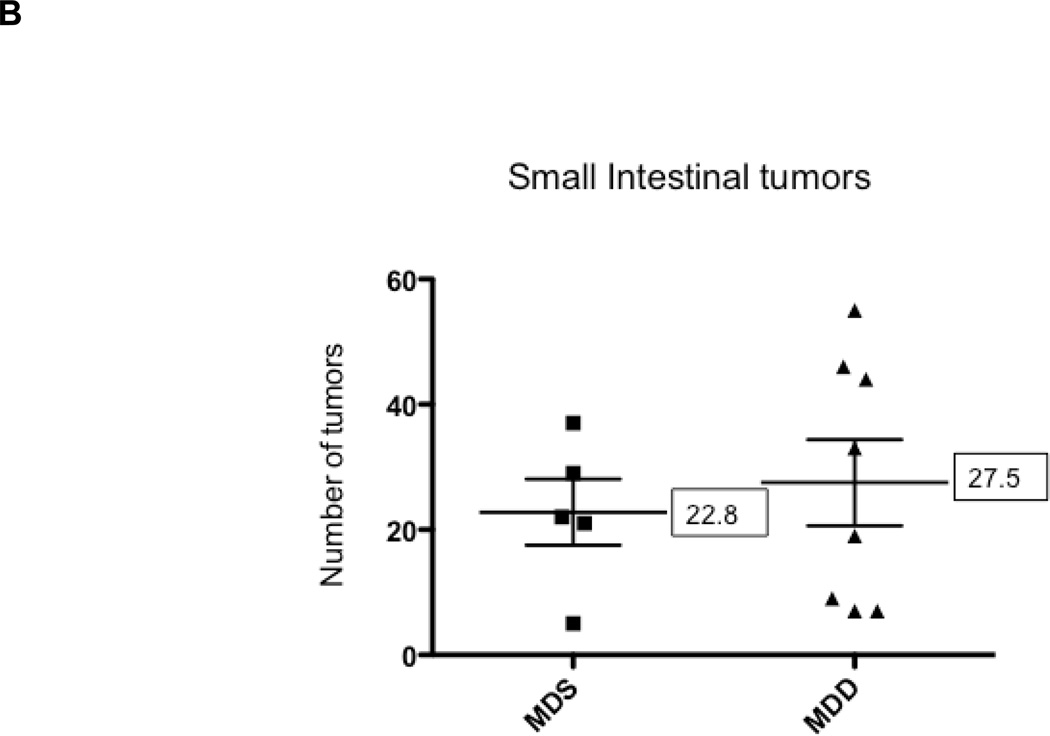
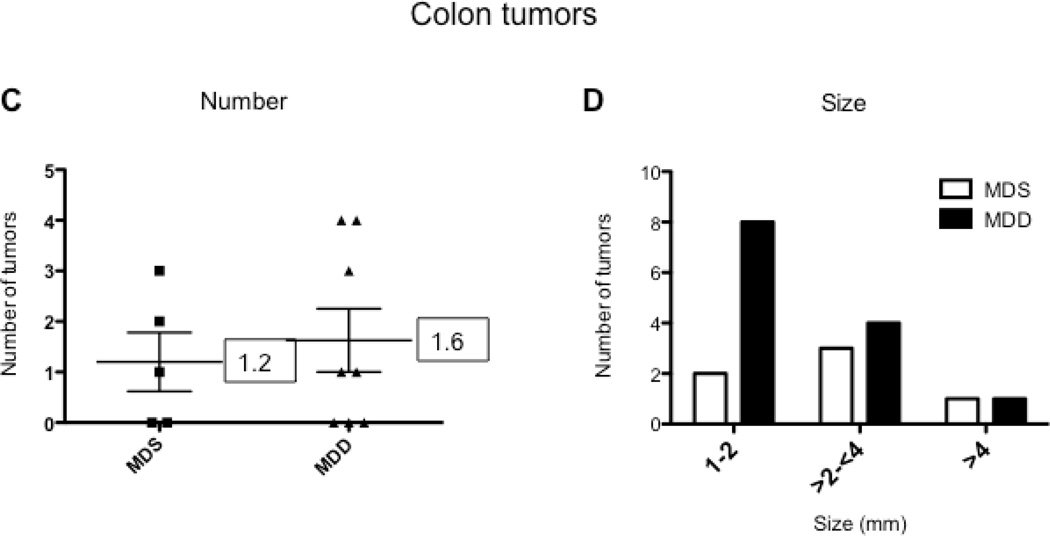
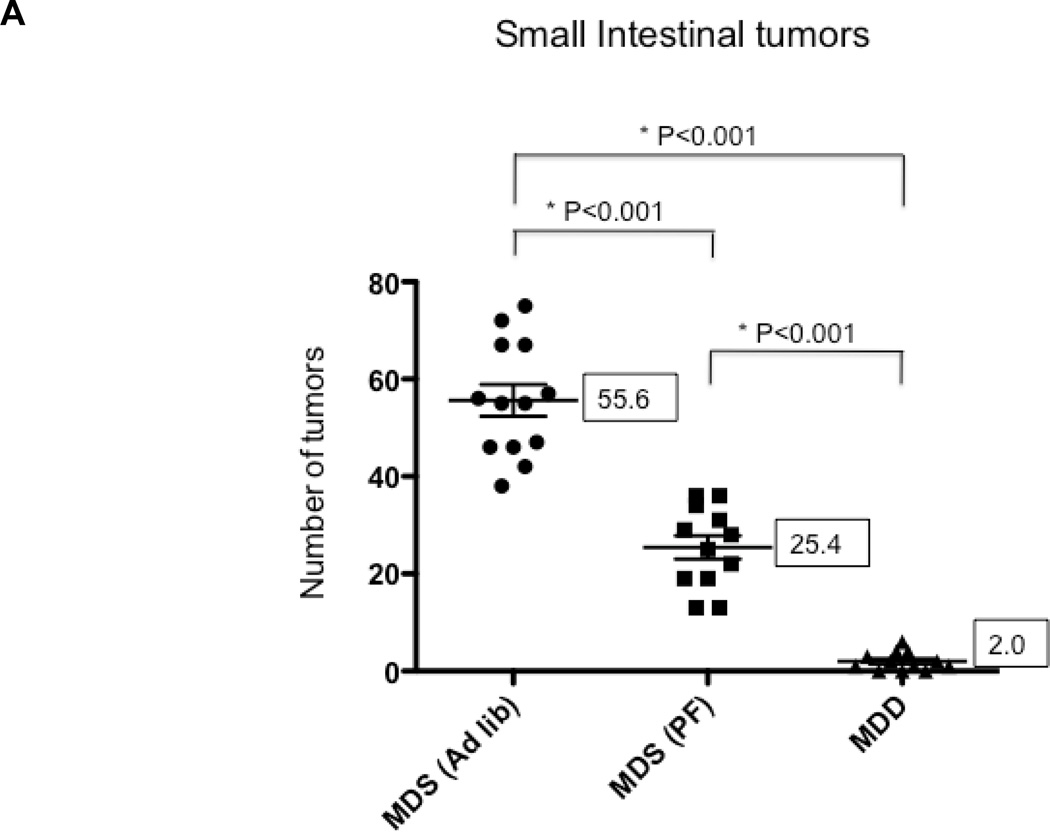
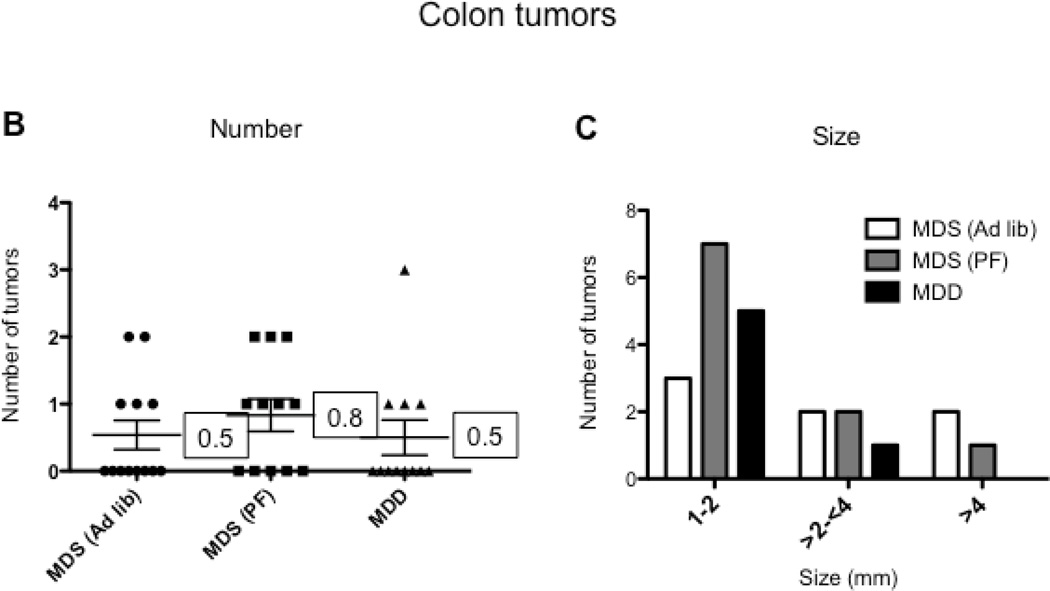
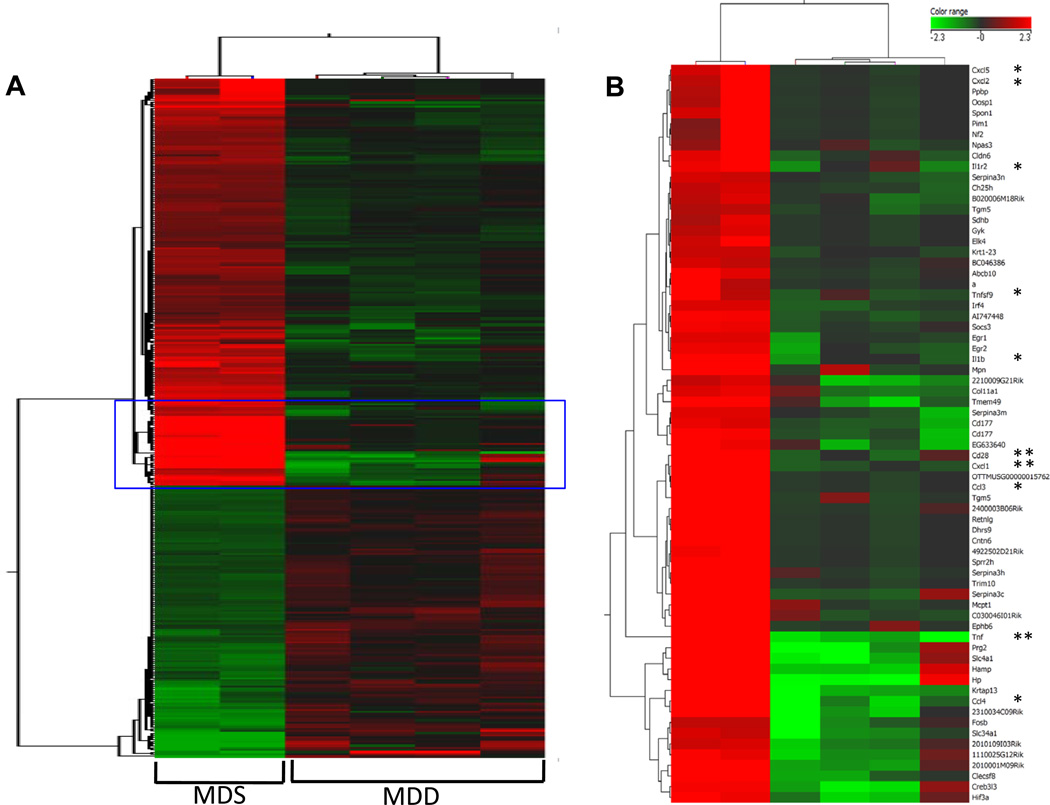
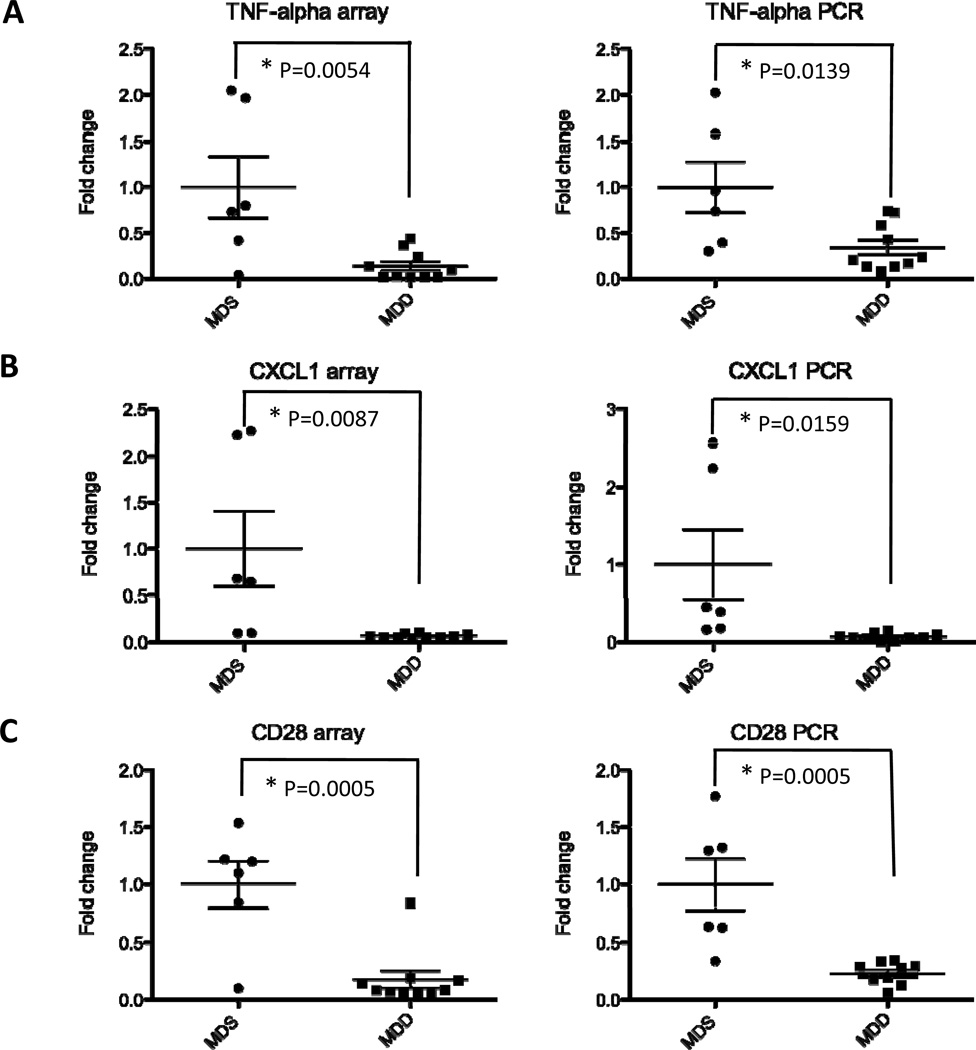
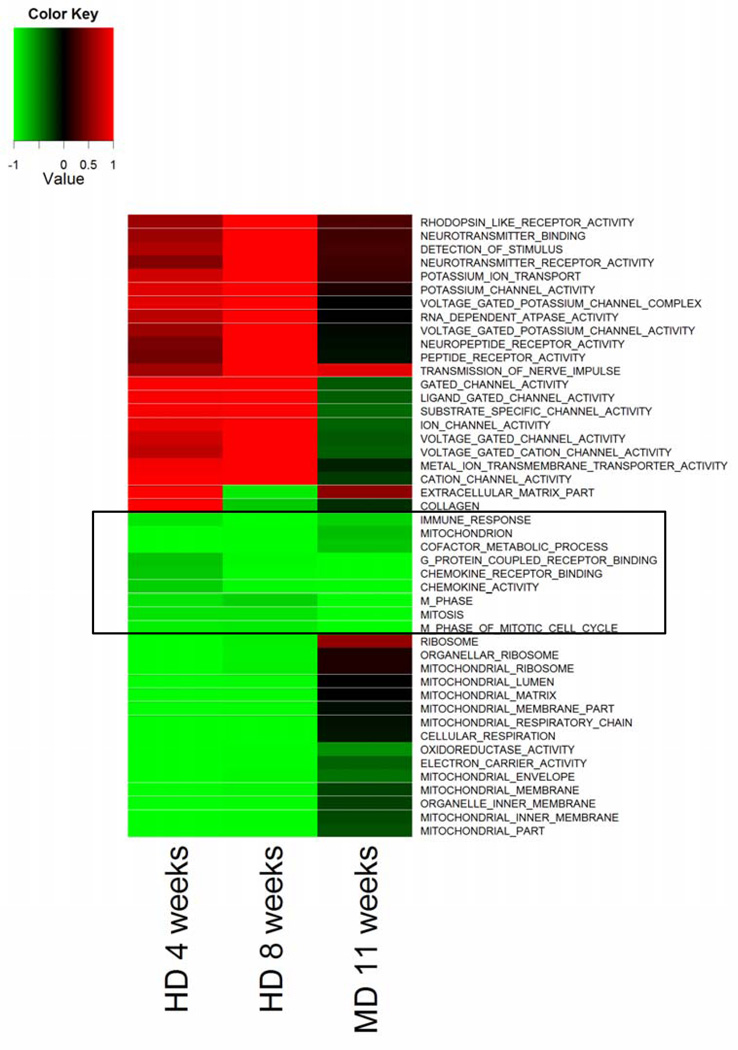
Despite recent population data, the influence of dietary folate supplementation on colon cancer risk remains controversial. This study examines the effects of folate deficiency, in combination with choline, methionine, and vitamin B12 depletion, on intestinal tumorigenesis in Apc(Min/+) mice. Methyl donor sufficient (MDS) and deficient (MDD) diets were started at five or 10 weeks of age and tumors evaluated at 16 weeks. MDD suppressed intestinal tumor formation in Apc(Min/+) mice (~80%) when started at five weeks of age. The protective effect was lost when MDD was initiated at 10 weeks of age, indicating an important time dependency on cancer suppression. Concomitant with cancer protection, MDD restricted body weight gain. Therefore, a second study was conducted in which MDS was given ad libitum or pair-fed with MDD. Although small intestinal tumors were reduced 54% in pair-fed MDS mice, MDD caused a further reduction (96%). In colon, although MDD did not affect tumor numbers, tumor size was reduced. Gene expression profiling of normal-appearing colonic mucosa after 11 weeks on MDD identified a total of 493 significantly downregulated genes relative to the MDS group. Pathway analysis placed many of these genes within general categories of inflammatory signaling and cell-cycle regulation, consistent with recently published human data obtained during folate depletion. Further studies are warranted to investigate the complex interplay of methyl donor status and cancer protection in high-risk populations.


Figures

Figure 1
Figure 1. Study design
A) Study 1: At five weeks of age, a total of 39 ApcMin/+ mice were randomized and placed into four experimental groups. Group I (n=12) received methyl donor sufficient diet (MDS) and Group II (n=14) received methyl donor deficient diet (MDD), for 11 weeks starting at 5 weeks of age. Group III (n=5) received MDS and Group IV (n=8) received MDD, for 6 weeks starting at 10 weeks of age. All mice were sacrificed at 16 weeks of age. B) Study 2: At five weeks of age, a total of 37 ApcMin/+ mice were randomized and placed into three experimental groups. Group I (MDS ad libitum, n=13) received methyl donor sufficient diet ad libitum, Group II (MDD, n=12) received methyl donor deficient diet and Group III (MDS pair-fed, n=12) were pair-fed with MDS diet to the same amount consumed by the Group II animals, for 11 weeks starting at 5 weeks of age. All mice were sacrificed at 16 weeks of age.
Figure 2
Figure 2. Body weight changes in ApcMin/+ mice maintained for 11 weeks on MDS or MDD diet (Study 1)
Mice were placed on MDS or MDD diet beginning at 5 weeks of age. Body weights were recorded weekly throughout the entire experimental period. Each data point represents the average body weight ± SEM for Group I (n=12) and Group II (n=14). Note that at the end of the study, there was an ~ 40% reduction in body weight in mice maintained on the MDD diet.
Figure 3
Figure 3. Body weight changes in ApcMin/+ mice maintained for 11 weeks on MDS or MDD diet (Study 2)
Mice were placed on MDS or MDD diet beginning at 5 weeks of age. Body weights were recorded weekly during the entire experimental period. Each data point represents the average body weight ± SEM for Group I (MDS ad libitum, n=13), Group II (MDD, n=12) and Group III (MDS pair-fed, n=12). Average body weights for Group II and Group III overlapped throughout the entire experimental period. Note that at the end of the study, there was an ~ 40% reduction in body weight in mice maintained on MDS pair-fed and MDD diets.
Figure 4
Figure 4. The effects of methyl donor depletion for 11 weeks on serum folate concentrations and intestinal tumor formation
A) Serum folate concentrations were determined by a microtiter plate assay using Lactobacillus casei, as described under Materials and Methods; B) and C) Total number of tumors per mouse in the small intestine (B) and colon (C) from MDS and MDD (n=9 per each group) mice, respectively. D) Colon tumors were classified by size as indicated. Note that there were no medium (between 2 and 4mm) or large-sized (≥4mm) colon tumors in the MDD group. Each data point represents an individual mouse and the numbers indicate the mean value for each group. P-values are indicated in the Figure and determined by unpaired t-tests.
Figure 5
Figure 5. The effects of methyl donor depletion for 6 weeks on serum folate concentrations and intestinal tumor formation
A) Serum folate concentrations were determined by a microtiter plate assay using Lactobacillus casei, as described under Materials and Methods; B) and C) Total number of tumors per mouse in the small intestine (B) and colon (C) from MDS (n=5) and MDD (n=8) mice, respectively. D) Colon tumors were classified by size as indicated. Each data point represents an individual mouse and the numbers indicate the mean value for each group. No statistically significant differences were observed between the groups.
Figure 6
Figure 6. The effect of reduced caloric intake and methyl donor depletion on intestinal tumor formation
A) and B) Total number of tumors per mouse in the small intestine (A) and colon (B) from MDS ad libitum (n=13), MDS pair-fed (n=12) and MDD (n=12) mice, respectively. C) Colon tumors were classified by size as indicated. Note that there were no large-sized (≥4mm) colon tumors in the MDD group. Each data point represents an individual mouse and the numbers indicate the mean value for each group. P-values are indicated in the Figure as determined using one-way analysis of variance followed by Bonferroni’s multiple comparison tests.
Figure 7
Figure 7. The effect of MDD diet on global gene expression patterns in the colons of ApcMin/+ mice
A) Total RNA was isolated from normal-appearing colonic mucosa from mice maintained on MDS or MDD diets for 11 weeks. Significantly expressed genes between the MDS and MDD groups, identified by adjusted t-tests, were clustered using a squared Euclidean algorithm. B) A set of genes that are related to inflammation and chemokine signaling are shown enlarged in the right panel. “*” Indicates genes related to chemokine pathways and “* *” indicates the genes that were further validated by qRT-PCR. The colored scale shown in the Figure represents the change in signal intensities.
Figure 8
Figure 8. Validation of gene expression changes induced by the MDD diet in ApcMin/+ colons
Total RNA was isolated from the colons of ApcMin/+ mice as described under Materials and Methods. To validate the array data obtained from Groups I and II, real-time PCR analysis was performed on three of the most significantly down-regulated genes within the pro-inflammatory network, including TNF-alpha (A), CXCL1 (B) and CD28 (C). Each data point represents the expression fold-change value for an individual mouse, with P values as indicated in the Figure. The left panels show the microarray data and the right panels show the qRT-PCR data.
Figure 9
Figure 9. Heatmap of Gene Set Enrichment Analysis for Gene Ontology comparing folate/methyl donor deficient mice to a human folate depletion study
The Figure compares significantly enriched GO categories in the human 4-week (HD 4 weeks) and 8-week (HD 8 weeks) dietary folate depletion studies to the present 11-week folate/methyl donor depletion study. Only categories with an FDR q-value of less than 0.001 in at least one condition are shown. Colors indicate down-regulation (green) or up-regulation (red), and values are represented as 1 - P (with down-regulation assigned negative values). Note that gene categories related to immune function and inflammation are down-regulated by folate/methyl depletion in the mouse colon and closely resemble the human data.

Similar articles

Cited by

References

    1. Protiva P, Mason JB, Liu Z, Hopkins ME, Nelson C, Marshall JR, et al. Altered folate availability modifies the molecular environment of the human colorectum: implications for colorectal carcinogenesis. Cancer Prev Res (Phila) 2011;4:530–543. - PMC - PubMed
    1. Mason JB. Folate, cancer risk, and the Greek god, Proteus: a tale of two chameleons. Nutr Rev. 2009;67:206–212. - PMC - PubMed
    1. Ulrich CM, Potter JD. Folate and cancer--timing is everything. Jama. 2007;297:2408–2409. - PubMed
    1. Giovannucci E. Epidemiologic studies of folate and colorectal neoplasia: a review. J Nutr. 2002;132:2350S–2355S. - PubMed
    1. Harnack L, Jacobs DR, Jr, Nicodemus K, Lazovich D, Anderson K, Folsom AR. Relationship of folate, vitamin B-6, vitamin B-12, and methionine intake to incidence of colorectal cancers. Nutr Cancer. 2002;43:152–158. - PubMed

Publication types

MeSH terms