

Optimal whole-body PET scanner configurations for different volumes of LSO scintillator: a simulation study
- PMID: 22678106
- PMCID: PMC3786676
- DOI: 10.1088/0031-9155/57/13/4077
Optimal whole-body PET scanner configurations for different volumes of LSO scintillator: a simulation study
Abstract
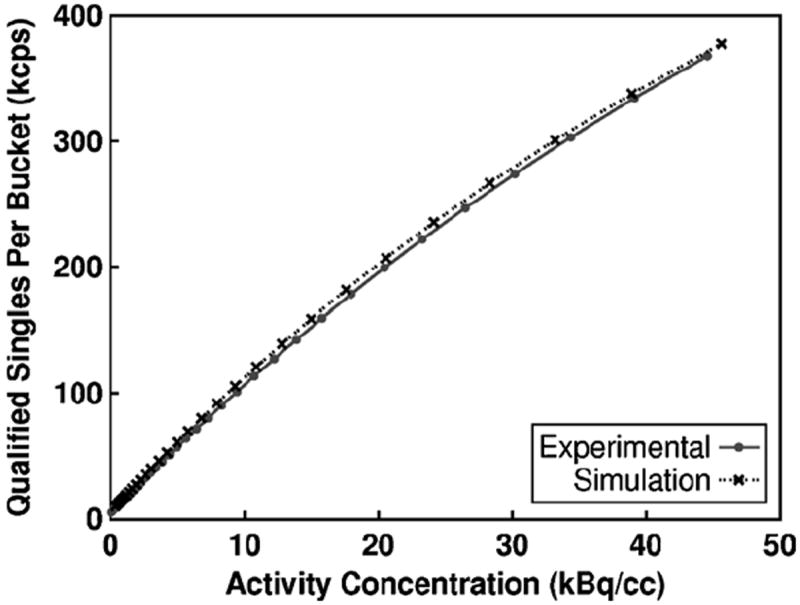
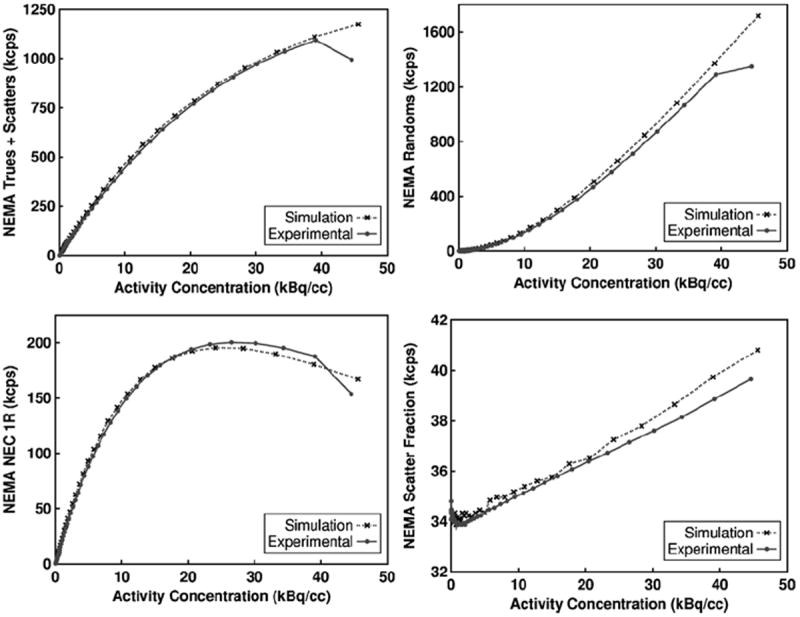
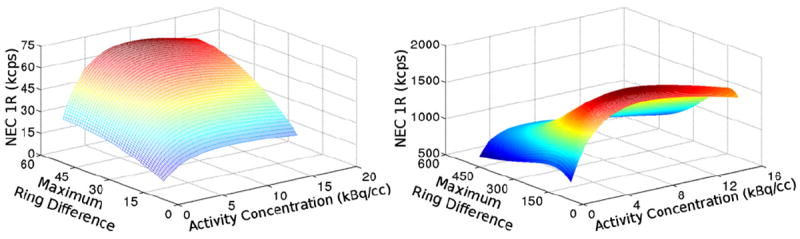
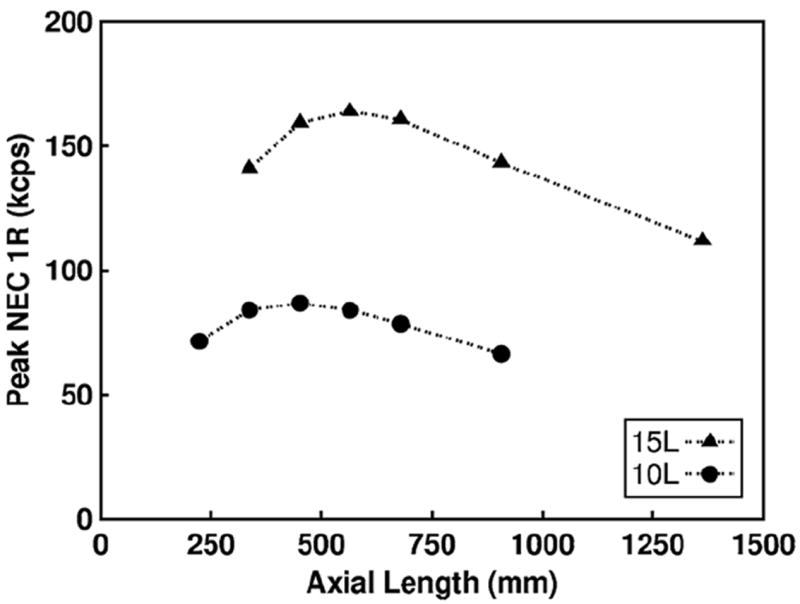
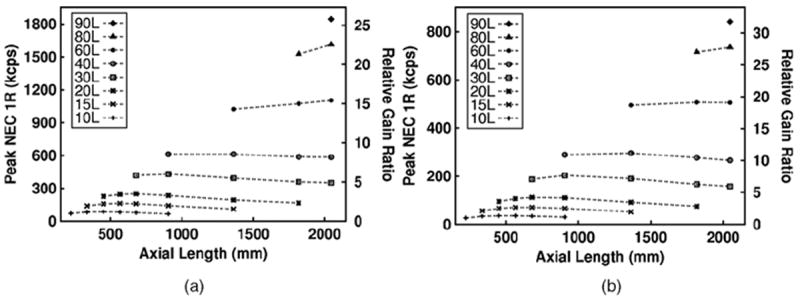
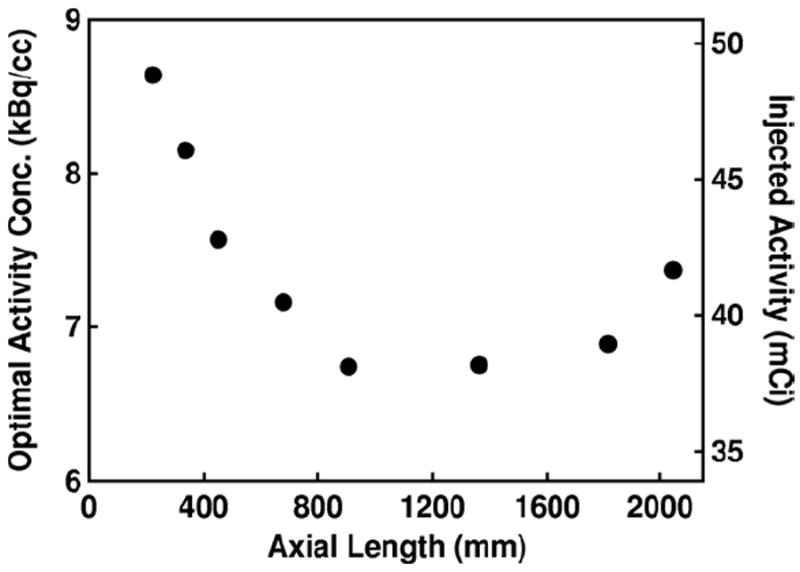
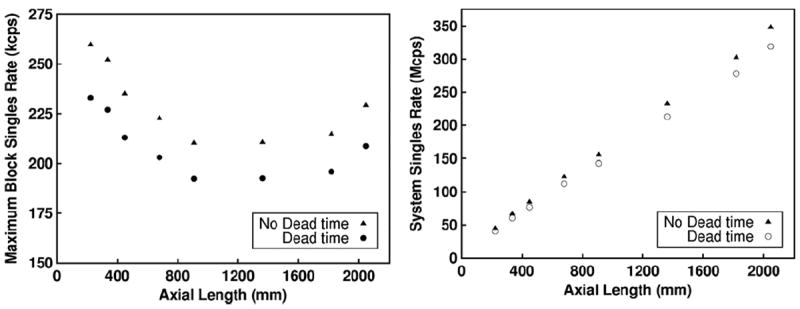
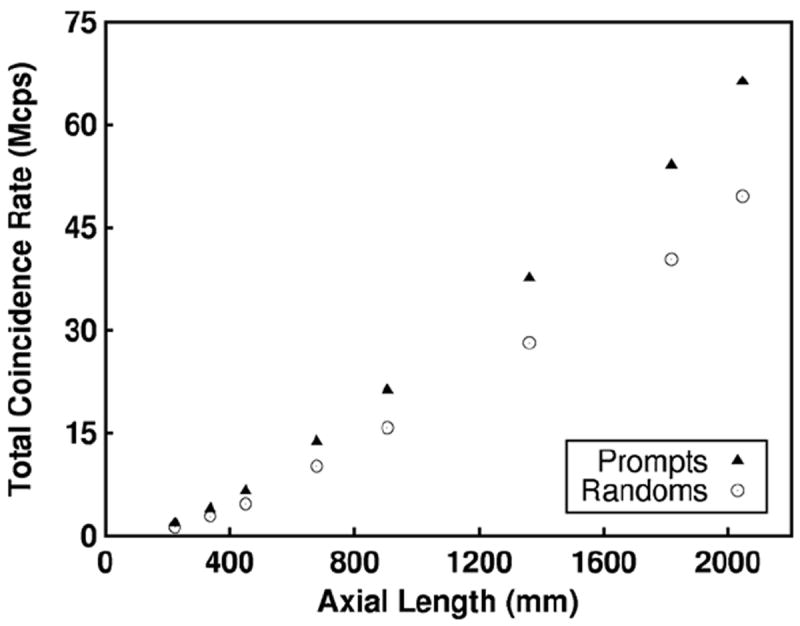
The axial field of view (AFOV) of the current generation of clinical whole-body PET scanners range from 15-22 cm, which limits sensitivity and renders applications such as whole-body dynamic imaging or imaging of very low activities in whole-body cellular tracking studies, almost impossible. Generally, extending the AFOV significantly increases the sensitivity and count-rate performance. However, extending the AFOV while maintaining detector thickness has significant cost implications. In addition, random coincidences, detector dead time, and object attenuation may reduce scanner performance as the AFOV increases. In this paper, we use Monte Carlo simulations to find the optimal scanner geometry (i.e. AFOV, detector thickness and acceptance angle) based on count-rate performance for a range of scintillator volumes ranging from 10 to 93 l with detector thickness varying from 5 to 20 mm. We compare the results to the performance of a scanner based on the current Siemens Biograph mCT geometry and electronics. Our simulation models were developed based on individual components of the Siemens Biograph mCT and were validated against experimental data using the NEMA NU-2 2007 count-rate protocol. In the study, noise-equivalent count rate (NECR) was computed as a function of maximum ring difference (i.e. acceptance angle) and activity concentration using a 27 cm diameter, 200 cm uniformly filled cylindrical phantom for each scanner configuration. To reduce the effect of random coincidences, we implemented a variable coincidence time window based on the length of the lines of response, which increased NECR performance up to 10% compared to using a static coincidence time window for scanners with a large maximum ring difference values. For a given scintillator volume, the optimal configuration results in modest count-rate performance gains of up to 16% compared to the shortest AFOV scanner with the thickest detectors. However, the longest AFOV of approximately 2 m with 20 mm thick detectors resulted in performance gains of 25-31 times higher NECR relative to the current Siemens Biograph mCT scanner configuration.
Figures
References
-
- Badawi RD, Adam LE, Zimmerman RE. A simulation-based assessment of the revised NEMA NU-2 70 cm long test phantom for PET. IEEE Nuclear Science Symp Conf Record. 2001:1466–70.
-
- Badawi RD, Kohlmyer SG, Harrison RL, Vannoy SD, Lewellen TK. The effect of camera geometry on singles flux, scatter fraction, and trues and randoms sensitivity of cylindrical 3D PET–a simulation study. IEEE Trans Nucl Sci. 2000;47:1228–32.
-
- Barrtzakos P, Thompson CJ. A depth-encoded PET detector. IEEE Trans Nucl Sci. 1991;38:732–8.
-
- Bettinardi V, Danna M, Savi A, Lecchi M, Castiglioni I, Gilardi MC, Bammer H, Lucignani G, Fazio F. Performance evaluation of the new whole-body PET/CT scanner: discovery ST. Eur J Nucl Med Mol Imaging. 2004;31:867–81. - PubMed
-
- Binkly DM, Puckett BS, Swann BK, Rochelle JA, Musrock MS, Casey ME. A 10-mc/s, 0.5-μm CMOS constant-fraction discriminator having built-in pulse tail cancellation. IEEE Nucl Trans Nucl Sci. 2002;49:1130–40.
Publication types
MeSH terms
Grants and funding
LinkOut - more resources
Full Text Sources
Other Literature Sources
Research Materials