

Combinatorial roles for histamine H1-H2 and H3-H4 receptors in autoimmune inflammatory disease of the central nervous system
- PMID: 22678907
- PMCID: PMC3508704
- DOI: 10.1002/eji.201141859
Combinatorial roles for histamine H1-H2 and H3-H4 receptors in autoimmune inflammatory disease of the central nervous system
Abstract
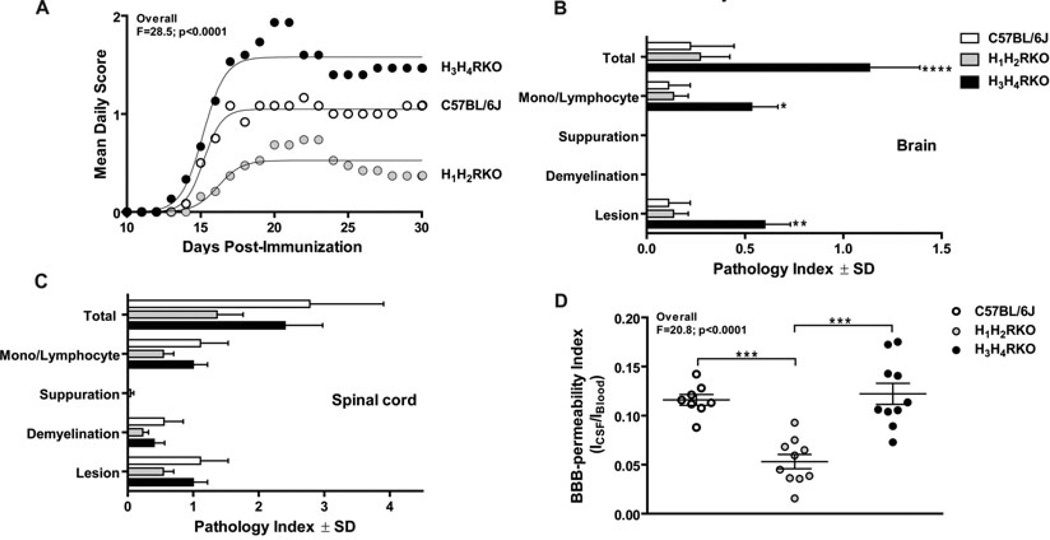
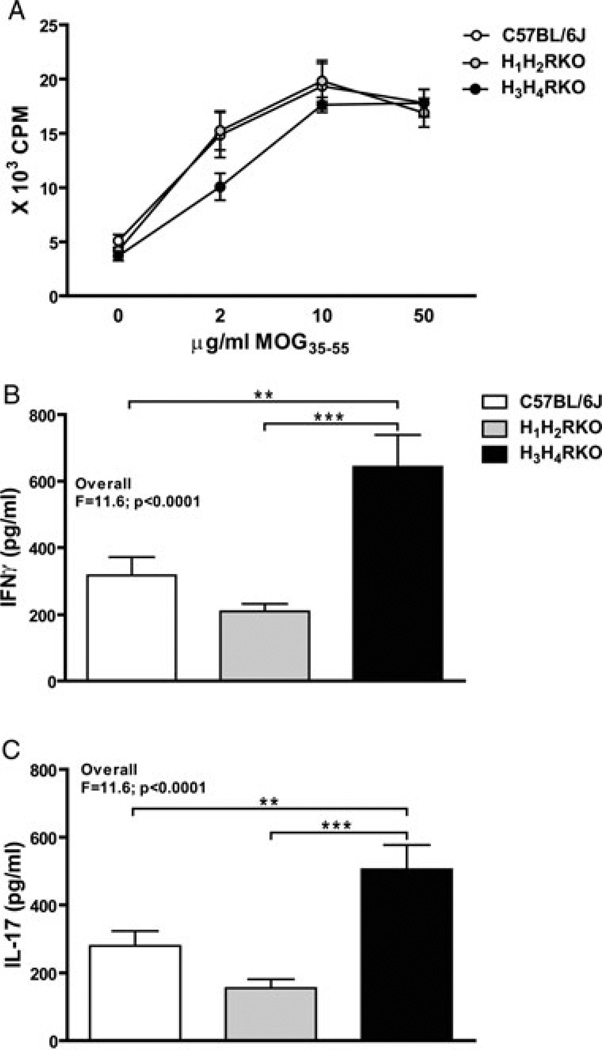
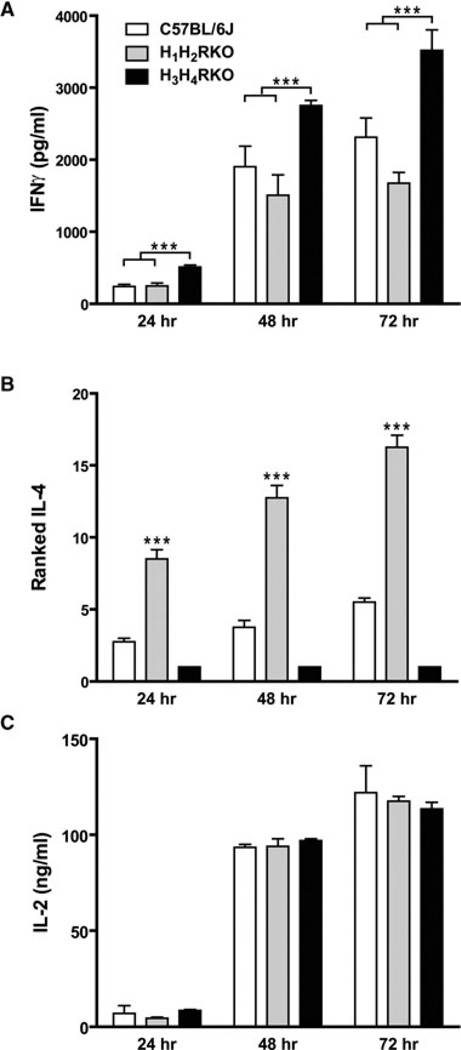
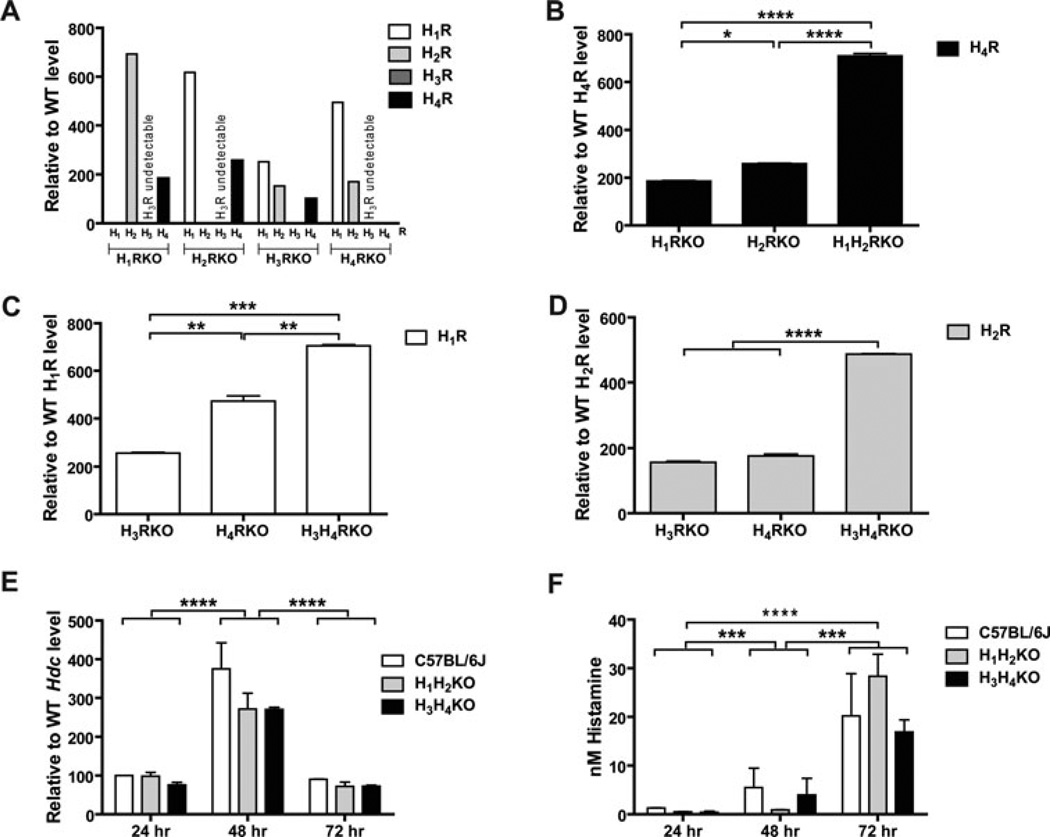
Multiple sclerosis (MS) is a chronic inflammatory demyelinating disease of the central nervous system in which histamine (HA) and its receptors have been implicated in disease pathogenesis. HA exerts its effects through four different G protein-coupled receptors designated H(1)-H(4). We previously examined the effects of traditional single HA receptor (HR) knockouts (KOs) in experimental allergic encephalomyelitis (EAE), the autoimmune model of MS. Our results revealed that H(1) R and H(2) R are propathogenic, while H(3) R and H(4) R are antipathogenic. This suggests that combinatorial targeting of HRs may be an effective disease-modifying therapy (DMT) in MS. To test this hypothesis, we generated H(1) H(2) RKO and H(3) H(4) RKO mice and studied them for susceptibility to EAE. Compared with wild-type (WT) mice, H(1) H(2) RKO mice developed a less severe clinical disease course, whereas the disease course of H(3) H(4) RKO mice was more severe. H(1) H(2) RKO mice also developed less neuropathology and disrupted blood brain barrier permeability compared with WT and H(3) H(4) RKO mice. Additionally, splenocytes from immunized H(1) H(2) RKO mice produced less interferon(IFN)-γ and interleukin(IL)-17. These findings support the concept that combined pharmacological targeting of HRs may be an appropriate ancillary DMT in MS and other immunopathologic diseases.
© 2012 WILEY-VCH Verlag GmbH & Co. KGaA, Weinheim.
Figures
Similar articles
-
Systemic lack of canonical histamine receptor signaling results in increased resistance to autoimmune encephalomyelitis.J Immunol. 2013 Jul 15;191(2):614-22. doi: 10.4049/jimmunol.1203137. Epub 2013 Jun 14. J Immunol. 2013. PMID: 23772030 Free PMC article.
-
Histamine H4 receptor optimizes T regulatory cell frequency and facilitates anti-inflammatory responses within the central nervous system.J Immunol. 2012 Jan 15;188(2):541-7. doi: 10.4049/jimmunol.1101498. Epub 2011 Dec 5. J Immunol. 2012. PMID: 22147765 Free PMC article.
-
New concepts of histamine receptors and actions.Curr Allergy Asthma Rep. 2003 May;3(3):227-31. doi: 10.1007/s11882-003-0044-3. Curr Allergy Asthma Rep. 2003. PMID: 12662472 Review.
-
Central histamine H3 receptor signaling negatively regulates susceptibility to autoimmune inflammatory disease of the CNS.Proc Natl Acad Sci U S A. 2007 Jun 12;104(24):10146-51. doi: 10.1073/pnas.0702291104. Epub 2007 Jun 4. Proc Natl Acad Sci U S A. 2007. PMID: 17548817 Free PMC article.
-
Histamine receptors in the lung.Agents Actions Suppl. 1991;33:103-22. doi: 10.1007/978-3-0348-7309-3_9. Agents Actions Suppl. 1991. PMID: 1647126 Review.
Cited by
-
Systemic lack of canonical histamine receptor signaling results in increased resistance to autoimmune encephalomyelitis.J Immunol. 2013 Jul 15;191(2):614-22. doi: 10.4049/jimmunol.1203137. Epub 2013 Jun 14. J Immunol. 2013. PMID: 23772030 Free PMC article.
-
Histaminergic system in brain disorders: lessons from the translational approach and future perspectives.Ann Gen Psychiatry. 2014 Nov 18;13(1):34. doi: 10.1186/s12991-014-0034-y. eCollection 2014. Ann Gen Psychiatry. 2014. PMID: 25426159 Free PMC article.
-
Histamine promotes the development of monocyte-derived dendritic cells and reduces tumor growth by targeting the myeloid NADPH oxidase.J Immunol. 2015 May 15;194(10):5014-21. doi: 10.4049/jimmunol.1402991. Epub 2015 Apr 13. J Immunol. 2015. PMID: 25870245 Free PMC article.
-
Cooling treatment transiently increases the permeability of brain capillary endothelial cells through translocation of claudin-5.Neurochem Res. 2013 Aug;38(8):1641-7. doi: 10.1007/s11064-013-1066-4. Epub 2013 May 9. Neurochem Res. 2013. PMID: 23653089
-
Fatigue, Sleep, and Autoimmune and Related Disorders.Front Immunol. 2019 Aug 6;10:1827. doi: 10.3389/fimmu.2019.01827. eCollection 2019. Front Immunol. 2019. PMID: 31447842 Free PMC article. Review.
References
-
- Greenstein JI. Current concepts of the cellular and molecular pathophysiology of multiple sclerosis. Dev. Neurobiol. 2007;67:1248–1265. - PubMed
-
- Akdis CA, Simons FE. Histamine receptors are hot in immunopharmacology. Eur. J. Pharmacol. 2006;533:69–76. - PubMed
-
- Metcalfe DD, Baram D, Mekori YA. Mast cells. Physiol. Rev. 1997;77:1033–1079. - PubMed
Publication types
MeSH terms
Substances
Grants and funding
LinkOut - more resources
Full Text Sources
Medical
Molecular Biology Databases
Miscellaneous
