

p53 suppresses type II endometrial carcinomas in mice and governs endometrial tumour aggressiveness in humans
- PMID: 22678923
- PMCID: PMC3494078
- DOI: 10.1002/emmm.201101063
p53 suppresses type II endometrial carcinomas in mice and governs endometrial tumour aggressiveness in humans
Abstract
Type II endometrial carcinomas are a highly aggressive group of tumour subtypes that are frequently associated with inactivation of the TP53 tumour suppressor gene. We show that mice with endometrium-specific deletion of Trp53 initially exhibited histological changes that are identical to known precursor lesions of type II endometrial carcinomas in humans and later developed carcinomas representing all type II subtypes. The mTORC1 signalling pathway was frequently activated in these precursor lesions and tumours, suggesting a genetic cooperation between this pathway and Trp53 deficiency in tumour initiation. Consistent with this idea, analyses of 521 human endometrial carcinomas identified frequent mTORC1 pathway activation in type I as well as type II endometrial carcinoma subtypes. mTORC1 pathway activation and p53 expression or mutation status each independently predicted poor patient survival. We suggest that molecular alterations in p53 and the mTORC1 pathway play different roles in the initiation of the different endometrial cancer subtypes, but that combined p53 inactivation and mTORC1 pathway activation are unifying pathogenic features among histologically diverse subtypes of late stage aggressive endometrial tumours.
Copyright © 2012 EMBO Molecular Medicine.
Figures

A. Upper panels: genotyping PCR of tail DNA to detect the Ksp1.3-Cre transgene (+ denotes present and − denotes absent) or the Trp53 floxed (fl) or wild-type (+) allele. Lower panels: PCR to detect Cre-mediated recombination at the Trp53 locus using DNA isolated from kidney, epididymis and uterus of the same mice used in the upper panels. The position of the recombined band is shown by Δ.
B. Real-time quantitative PCR analysis of Trp53 mRNA abundance (normalized to 18S RNA abundance) in indicated tissues from wild-type (white bars) or Trp53Δ/Δ (black bars) mice.
C-H. Haematoxylin and eosin stain of sections of kidneys (C and D), epididymis (E and F) and uterus (G and H) from wild-type or Trp53Δ/Δ mice aged 10 weeks (C, D, G and H) or 6 months (E and F). (I–N) Examples of tumours that arose in 14–16-month-old knockout mice. Arrowheads in (F) highlight atypical nuclei. All scale bars represent 50 µm.
I-N. Serous AdCa with papillary growth pattern (I), Clear cell AdCa with papillary growth pattern (J), Serous AdCa with acinar growth pattern (K), Clear cell AdCa with acinar growth pattern (L). Carcinosarcoma displaying mixed clear cell and (heterologous) chrondrosarcoma components (M), Undifferentiated carcinoma (N).
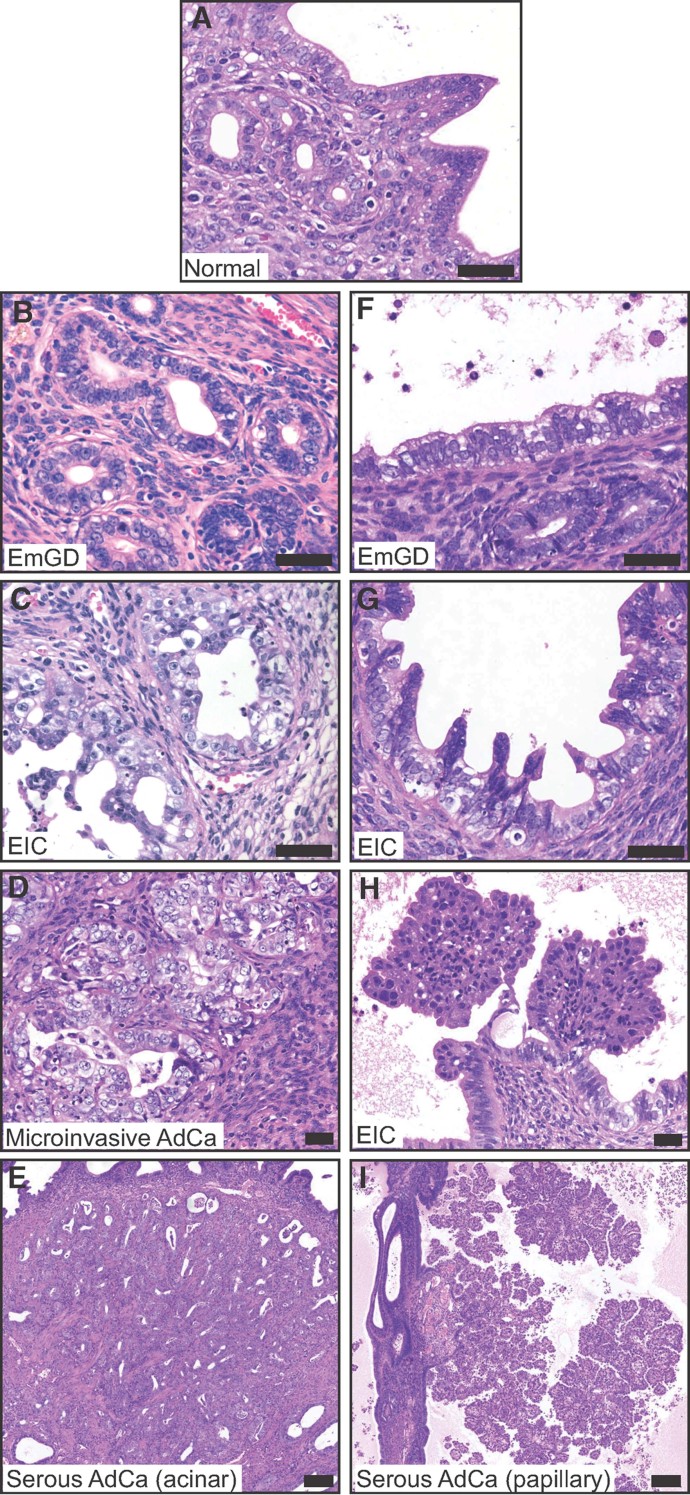
A. Normal endometrial glands and lumenal surface epithelium.
B-E. Examples of lesions illustrating the proposed progression model from EmGD arising in glands (B), to EIC in the glands (C) to microinvasive AdCa (D) to serous AdCa with acinar growth pattern (E).
F-I. Examples of lesions illustrating the proposed progression model from EmGD arising in lumenal surface epithelium (F), to EIC in the lumen (G) to EIC with papillary growth (H) to serous AdCa with papillary growth pattern (I). Scale bars in A–H depict 50 µm and in E and F depicts 200 µm.

A-F. Two examples of EIC with papillary growth.
G-I. Low-power image of a serous AdCa and dysplastic adjacent epithelia.
J-L. Non-dysplastic endometrial surface epithelium from a region that is continuous with the upper epithelium but outside of the fields shown in (G–I).
M-O. Zoom of boxed region 1 from (G) to (I) showing EmGD.
P-R. Zoom of boxed region 2 from (G) to (I) showing the transition from EmGD (multi-layered epithelium below/left of the arrowhead) to EIC/serous AdCa (epithelium above/right of the arrowhead). Scale bars in (G–I) represent 200 µm, in all other panels 50 µm.

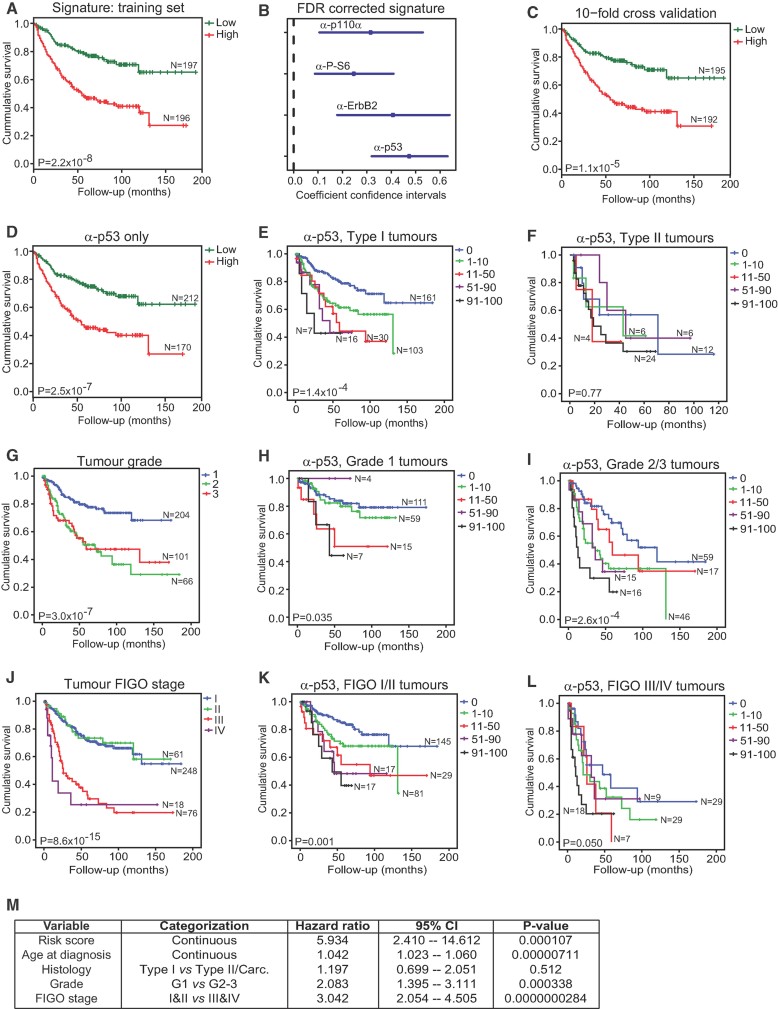
A. Kaplan–Meier plots of low-risk and high-risk patients using a four-marker risk-model signature for endometrial carcinoma based on staining patterns for p110α, P-S6, ErbB2 and p53.
B. Contribution of each marker to the signature represented by coefficients and confidence intervals.
C. Patient stratification based on 10-fold cross-validation of the linear risk score model.
D-L. Patient stratification based on the median split of p53 expression frequency only (D). Kaplan–Meier survival plots of subgroups of patients based on p53 staining in type I tumours (E), p53 staining in type II tumours (F), tumour grade (G), p53 staining in grade 1 tumours (H), p53 staining in grade 2 and 3 tumours (I), tumour FIGO stage (J), p53 staining in FIGO stage I and II tumours (K) and p53 staining in FIGO stage III and IV tumours (L). Log Rank (Mantel–Cox) tests were conducted to test for equality in the survival expectation of each group. N-values represent the number of patients in each group.
M. Multivariate Cox regression analysis of factors possibly influencing overall survival of patients with endometrial carcinoma (n = 360, number of events = 112, 50 observations deleted due to missing values). Carc., carcinosarcoma.

Total number of different mutations affecting the coding sequence in endometrioid or serous carcinomas grouped according to p53 IHC score. There are no significant differences between groups.
Cumulative frequency of sequencing reads exhibiting one or more mutations. Scores of over 100% indicate that multiple independent mutations occur in the tumour. There are no significant differences between groups.
Frequency at which the dominant mutation is represented in the tumour DNA.
Percentage of tumours for which the dominant mutations depicted in C are predicted to have no impact or a low, medium or high-negative functional impact on the p53 protein.
Frequency at which the dominant mutation is represented in an individual tumour, grouped according to predicted functional impact of the mutation. In A, B, C and E, statistically significant differences between groups were calculated using a one-way ANOVA and Bonferroni's multiple comparison test and depicted as *p < 0.05, **p < 0.01 or ***p < 0.001.
Kaplan–Meier survival plots of patients based on the frequency of occurrence of the dominant TP53 mutation.
Similar articles
-
[p53 suppresses type II endometrial carcinomas in mice and governs endometrial tumor aggressiveness in humans].Pathologe. 2013 Nov;34 Suppl 2:180-8. doi: 10.1007/s00292-013-1859-x. Pathologe. 2013. PMID: 24196610 German.
-
Stromal liver kinase B1 [STK11] signaling loss induces oviductal adenomas and endometrial cancer by activating mammalian Target of Rapamycin Complex 1.PLoS Genet. 2012;8(8):e1002906. doi: 10.1371/journal.pgen.1002906. Epub 2012 Aug 16. PLoS Genet. 2012. PMID: 22916036 Free PMC article.
-
AKT induces senescence in human cells via mTORC1 and p53 in the absence of DNA damage: implications for targeting mTOR during malignancy.Oncogene. 2012 Apr 12;31(15):1949-62. doi: 10.1038/onc.2011.394. Epub 2011 Sep 12. Oncogene. 2012. PMID: 21909130 Free PMC article.
-
Molecular carcinogenesis of endometrial cancer.Taiwan J Obstet Gynecol. 2007 Mar;46(1):26-32. doi: 10.1016/S1028-4559(08)60102-3. Taiwan J Obstet Gynecol. 2007. PMID: 17389185 Review.
-
Does a p53 "Wild-type" Immunophenotype Exclude a Diagnosis of Endometrial Serous Carcinoma?Adv Anat Pathol. 2018 Jan;25(1):61-70. doi: 10.1097/PAP.0000000000000171. Adv Anat Pathol. 2018. PMID: 28945609 Review.
Cited by
-
Clinical actionability of molecular targets in endometrial cancer.Nat Rev Cancer. 2019 Sep;19(9):510-521. doi: 10.1038/s41568-019-0177-x. Epub 2019 Aug 6. Nat Rev Cancer. 2019. PMID: 31388127 Free PMC article. Review.
-
Seminal fluid metabolome and epididymal changes after antibiotic treatment in mice.Reproduction. 2018 Jul;156(1):1-10. doi: 10.1530/REP-18-0072. Epub 2018 Apr 24. Reproduction. 2018. PMID: 29692359 Free PMC article.
-
Expression of the putative cannabinoid receptor GPR55 is increased in endometrial carcinoma.Histochem Cell Biol. 2021 Nov;156(5):449-460. doi: 10.1007/s00418-021-02018-4. Epub 2021 Jul 29. Histochem Cell Biol. 2021. PMID: 34324032 Free PMC article.
-
Cells expressing PAX8 are the main source of homeostatic regeneration of adult mouse endometrial epithelium and give rise to serous endometrial carcinoma.Dis Model Mech. 2020 Oct 30;13(10):dmm047035. doi: 10.1242/dmm.047035. Dis Model Mech. 2020. PMID: 32998907 Free PMC article.
-
The impact of microRNA-mediated PI3K/AKT signaling on epithelial-mesenchymal transition and cancer stemness in endometrial cancer.J Transl Med. 2014 Aug 21;12:231. doi: 10.1186/s12967-014-0231-0. J Transl Med. 2014. PMID: 25141911 Free PMC article. Review.
References
-
- Abeln EC, Smit VT, Wessels JW, de Leeuw WJ, Cornelisse CJ, Fleuren GJ. Molecular genetic evidence for the conversion hypothesis of the origin of malignant mixed mullerian tumours. J Pathol. 1997;183:424–431. - PubMed
-
- Ambros RA, Sherman ME, Zahn CM, Bitterman P, Kurman RJ. Endometrial intraepithelial carcinoma: a distinctive lesion specifically associated with tumors displaying serous differentiation. Hum Pathol. 1995;26:1260–1267. - PubMed
-
- An HJ, Logani S, Isacson C, Ellenson LH. Molecular characterization of uterine clear cell carcinoma. Mod Pathol. 2004;17:530–537. - PubMed
-
- Catasus L, Gallardo A, Cuatrecasas M, Prat J. Concomitant PI3K-AKT and p53 alterations in endometrial carcinomas are associated with poor prognosis. Mod Pathol. 2009;22:522–529. - PubMed
Publication types
MeSH terms
Substances
LinkOut - more resources
Full Text Sources
Other Literature Sources
Molecular Biology Databases
Research Materials
Miscellaneous
